Hi Traders!
The market is in an overall Downtrend.
We are going to start the Multiple Timeframe Analysis with the Weekly TF.
Then, we'll analyse the Daily, H4 and H1 Timeframes too.
Here is the screenshot of the Weekly Timeframe:

As you can see the main thing here is the falling Wedge.
The market is moving in between those two descending Trendlines.
Why is this Wedge so powerful?
Because the price respected this Wedge more than the monthly Support:
Here we can recognize the bearish Breakout of the Support in-between the Wedge.
After the Breakout it started a consolidation.
If we have a bearish Breakout of the Consolidation Box, we expect the Target of 101.000.
At this Level the market has moved up fastly the last two times.
Let's move on to the Daily TF:

This movement of the price can be devided into four pieces:
Now we have two possible scenarios that the price could take:
- Scenario 1:
The price jumpes off the Support and reaches the blue dotted line.
This line represents the Level of Breakout.
The idea is here to trade the Retracement Movement to make the Retest.
- Scenario 2:
It is also possible, that the market breaks out bearish.
Than the Target would be the Level 101.000.
It is important to trade here the Retest of the bearish Breakout to avoid a False Break.
Let's move on to the H4-TF:

Here, the price moves in a Parallel Channel.
We have two possible Trading Setups here:
The market is in an overall Downtrend.
We are going to start the Multiple Timeframe Analysis with the Weekly TF.
Then, we'll analyse the Daily, H4 and H1 Timeframes too.
Here is the screenshot of the Weekly Timeframe:
As you can see the main thing here is the falling Wedge.
The market is moving in between those two descending Trendlines.
Why is this Wedge so powerful?
Because the price respected this Wedge more than the monthly Support:
Here we can recognize the bearish Breakout of the Support in-between the Wedge.
After the Breakout it started a consolidation.
If we have a bearish Breakout of the Consolidation Box, we expect the Target of 101.000.
At this Level the market has moved up fastly the last two times.
Let's move on to the Daily TF:
This movement of the price can be devided into four pieces:
- The price moved in the falling Wedge
- The price moved in the descending Triangle
- The price broke out of the weekly Support and formed a "neutrale" Triangle
(it is neither ascending nor descending) - The price moves in the consolidation box.
Now we have two possible scenarios that the price could take:
- Scenario 1:
The price jumpes off the Support and reaches the blue dotted line.
This line represents the Level of Breakout.
The idea is here to trade the Retracement Movement to make the Retest.
- Scenario 2:
It is also possible, that the market breaks out bearish.
Than the Target would be the Level 101.000.
It is important to trade here the Retest of the bearish Breakout to avoid a False Break.
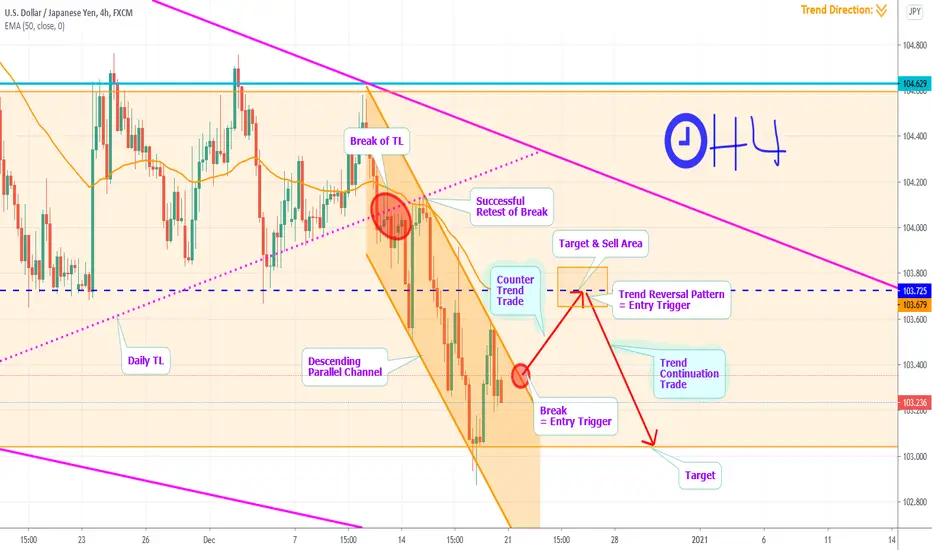
Let's move on to the H4-TF:
Here, the price moves in a Parallel Channel.
We have two possible Trading Setups here:
- The Counter Trend Trade
In this Setup, we buy the bullish Breakout of the Parallel Channel.
The reason is to profit from the Retracement Move. - The Trend Continuation Trade
When the market finally reaches this orange Area, we are going to wait for a Trend Reversal (Candlestick) Pattern.
Then we sell the price with the Trend towards the Bottom of the big main Consolidation Box.
Lastly the H1-Entry-Timeframe:
Here we explain the details for the Setup for the Counter Trend Trade.
As you can see the price is now in a Triangle.
So, we can have two Entries:
- Entry 1 is at the bullish Breakout of the H1-Triangle.
- Entry 2 is the bullish Breakout of the Parallel Channel.
The SL for Entry 1 is below the recent low.
The SL for Entry 2 is depending on how the price gets to make this Breakout and the SL could be below one of these potential higher Lows.
The Target is the Area around the blue dotted Breakout Level.
We recommend to trade with a small risk if you counter trend trade.Thanks and successful Trading :)!
Disclaimer
The information and publications are not meant to be, and do not constitute, financial, investment, trading, or other types of advice or recommendations supplied or endorsed by TradingView. Read more in the Terms of Use.
Disclaimer
The information and publications are not meant to be, and do not constitute, financial, investment, trading, or other types of advice or recommendations supplied or endorsed by TradingView. Read more in the Terms of Use.