USD/JPY Daily Timeframe Analysis
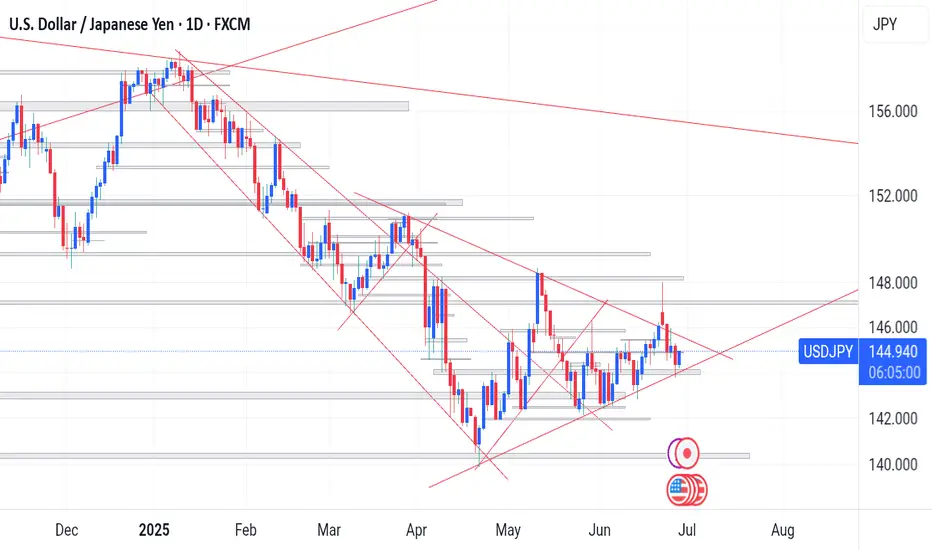
A symmetrical triangle pattern has formed on the daily chart, indicating that a potential breakout could occur in either direction. If the pattern plays out, we should be looking for a breakout and retest of the trendline towards the downside.
A symmetrical triangle pattern has formed on the daily chart, indicating that a potential breakout could occur in either direction. If the pattern plays out, we should be looking for a breakout and retest of the trendline towards the downside.
Disclaimer
The information and publications are not meant to be, and do not constitute, financial, investment, trading, or other types of advice or recommendations supplied or endorsed by TradingView. Read more in the Terms of Use.
Disclaimer
The information and publications are not meant to be, and do not constitute, financial, investment, trading, or other types of advice or recommendations supplied or endorsed by TradingView. Read more in the Terms of Use.