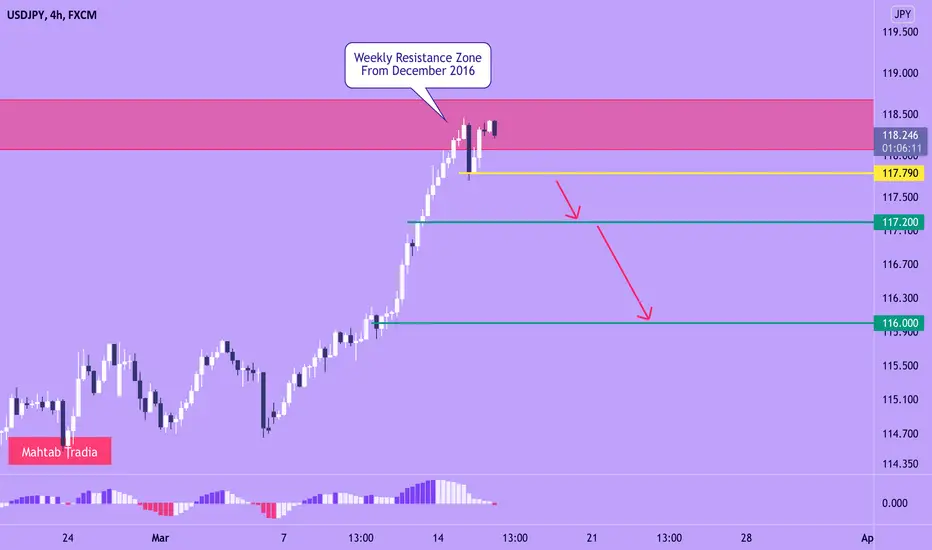
After a big significant growth, price has reached the strong weekly resistance zone which has been existed since December 2016.
Currently, in the 4H time frame, we can see a downside push on price and it seems like it is making a reversal double top pattern.
There is a yellow support level at 117.790 which is also the last price low. If price breaks this level and closes a bearish candle below it, we can expect a drop on USDJPY to 117.200 and in the case of more downside pressure, price may drop more to visit 116 as well.
Disclaimer
The information and publications are not meant to be, and do not constitute, financial, investment, trading, or other types of advice or recommendations supplied or endorsed by TradingView. Read more in the Terms of Use.
Disclaimer
The information and publications are not meant to be, and do not constitute, financial, investment, trading, or other types of advice or recommendations supplied or endorsed by TradingView. Read more in the Terms of Use.
