SMC trading point update
Technical analysis of USD/JPY (U.S. Dollar vs. Japanese Yen) on the 4-hour timeframe. Here's a breakdown of the analysis:
---
Trend & Price Action
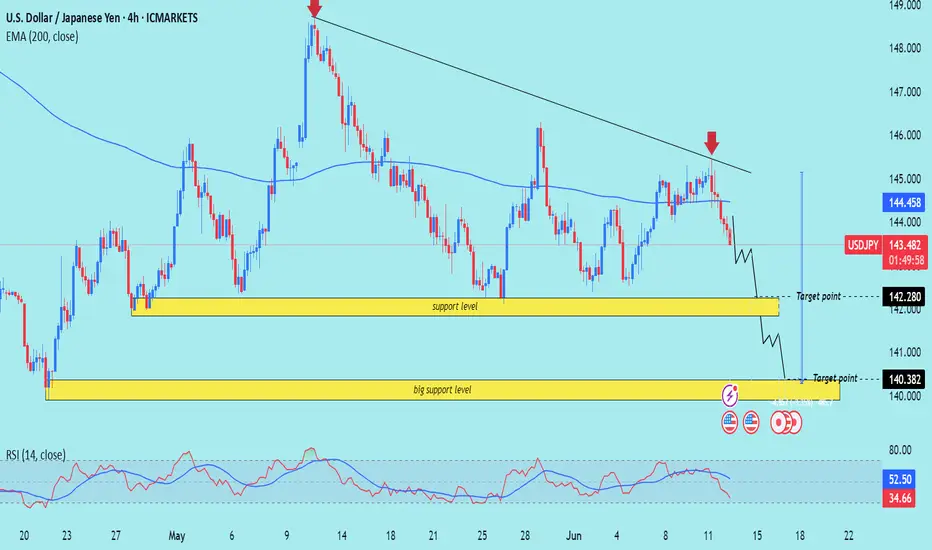
The chart shows a descending trendline connecting recent lower highs, indicating a downtrend.
Current price: 143.548
Price has recently rejected off the trendline and started to fall, suggesting continued bearish momentum.
A red arrow marks the rejection point, emphasizing a key resistance area.
---
Technical Indicators
EMA 200 (Exponential Moving Average): At 144.459 — the price is currently below the EMA, reinforcing the bearish outlook.
RSI (Relative Strength Index):
RSI (14) values: around 35.45, which is near the oversold threshold (30) but not quite there yet.
Indicates increasing bearish momentum but no reversal signal yet.
---
Support Levels Identified
1. Support Level (Target 1): ~142.280
First target point for bears. Likely to see some reaction or consolidation here.
2. Big Support Level (Target 2): ~140.382
A stronger, more significant support zone and a deeper bearish target if the first support breaks.
---
Bearish Target Scenario
The projected path (in black lines) suggests:
A further drop into the 142.280 zone.
If that breaks, a continuation toward the 140.382 level.
This suggests a swing trade setup favoring short positions if the price respects the current rejection zone.
Mr SMC Trading point
---
Conclusion
Bias: Bearish
Resistance Confirmed: Rejection from descending trendline and below EMA200.
Bearish Targets:
Short-term: 142.280
Medium-term: 140.382
Risk Management: Watch RSI for potential bullish divergence near the second support zone, which could indicate reversal or consolidation.
---
Please support boost 🚀 this analysis)
Technical analysis of USD/JPY (U.S. Dollar vs. Japanese Yen) on the 4-hour timeframe. Here's a breakdown of the analysis:
---
Trend & Price Action
The chart shows a descending trendline connecting recent lower highs, indicating a downtrend.
Current price: 143.548
Price has recently rejected off the trendline and started to fall, suggesting continued bearish momentum.
A red arrow marks the rejection point, emphasizing a key resistance area.
---
Technical Indicators
EMA 200 (Exponential Moving Average): At 144.459 — the price is currently below the EMA, reinforcing the bearish outlook.
RSI (Relative Strength Index):
RSI (14) values: around 35.45, which is near the oversold threshold (30) but not quite there yet.
Indicates increasing bearish momentum but no reversal signal yet.
---
Support Levels Identified
1. Support Level (Target 1): ~142.280
First target point for bears. Likely to see some reaction or consolidation here.
2. Big Support Level (Target 2): ~140.382
A stronger, more significant support zone and a deeper bearish target if the first support breaks.
---
Bearish Target Scenario
The projected path (in black lines) suggests:
A further drop into the 142.280 zone.
If that breaks, a continuation toward the 140.382 level.
This suggests a swing trade setup favoring short positions if the price respects the current rejection zone.
Mr SMC Trading point
---
Conclusion
Bias: Bearish
Resistance Confirmed: Rejection from descending trendline and below EMA200.
Bearish Targets:
Short-term: 142.280
Medium-term: 140.382
Risk Management: Watch RSI for potential bullish divergence near the second support zone, which could indicate reversal or consolidation.
---
Please support boost 🚀 this analysis)
(Services:✔️ JOIN Telegram channel
#Gold trading ★Analysis★ 📊
Gold trading signals 🚀 99%
t.me/SmcTradingPoin
Join my recommended broker , link 👇
World best broker exness ✅D
one.exnesstrack.org/a/l1t1rf3p6v
#Gold trading ★Analysis★ 📊
Gold trading signals 🚀 99%
t.me/SmcTradingPoin
Join my recommended broker , link 👇
World best broker exness ✅D
one.exnesstrack.org/a/l1t1rf3p6v
Related publications
Disclaimer
The information and publications are not meant to be, and do not constitute, financial, investment, trading, or other types of advice or recommendations supplied or endorsed by TradingView. Read more in the Terms of Use.