SMC trading point update
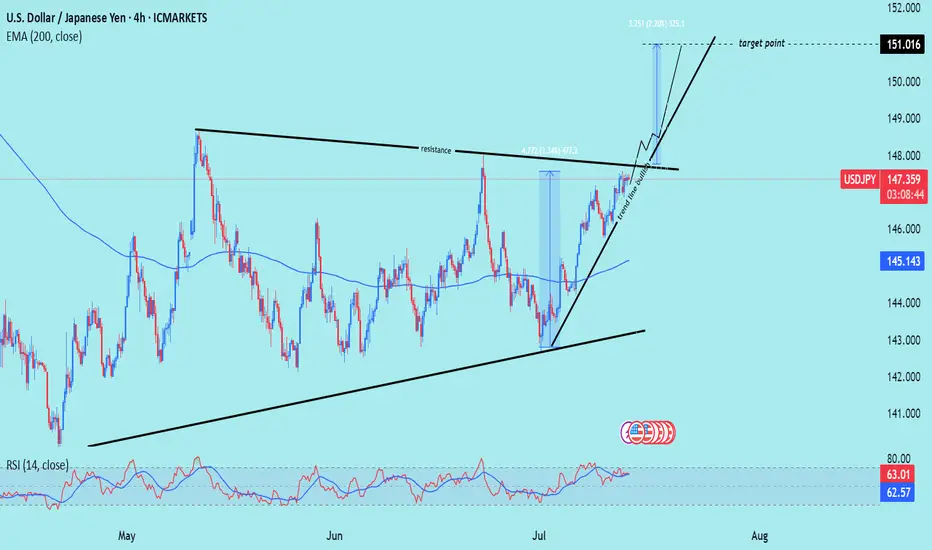
Technical analysis of USD/JPY on the 4-hour timeframe, signaling a breakout and possible rally toward the 151.016 target zone. Here's the detailed breakdown:
---
Technical Analysis – USD/JPY (4H)
1. Bullish Structure Breakout
Price has broken above a long-term resistance trendline, indicating a bullish breakout from a rising wedge or ascending channel.
The breakout is confirmed by bullish momentum and sustained price action above the previous highs.
2. Trendline + EMA Confluence
Price remains well above the 200 EMA (145.143), reinforcing the bullish bias.
A clear higher low was formed at the inner trendline (support), followed by strong upside moves.
3. RSI Strength
RSI is around 63.16, indicating strong bullish momentum without being overbought yet.
Suggests more upside potential while maintaining healthy trend conditions.
4. Price Target Projection
The chart shows two upward extensions:
First move projected ~+2.20%, indicating a measured move target around 149.7.
Final target point is 151.016, based on previous price action extension and resistance level.
Mr SMC Trading point
---
Summary
Bias: Bullish
Current Price: 147.366
Key Support: Rising trendline + 145.143 EMA
Targets:
Short-term: ~149.7
Final: 151.016
RSI: Strong but not overbought (63.16)
Invalidation: Break below the inner trendline support and EMA (below 145.00)
Please support boost 🚀 this analysis)
Trade active
guys trade active (Services:✔️ JOIN Telegram channel
t.me/+BLfaeRJ48BBmNjM8
Gold trading signals 🚀 99%
t.me/+BLfaeRJ48BBmNjM8
Join my recommended broker , link 👇
World best broker exness ✅D
one.exnesstrack.org/a/l1t1rf3p6v
t.me/+BLfaeRJ48BBmNjM8
Gold trading signals 🚀 99%
t.me/+BLfaeRJ48BBmNjM8
Join my recommended broker , link 👇
World best broker exness ✅D
one.exnesstrack.org/a/l1t1rf3p6v
Related publications
Disclaimer
The information and publications are not meant to be, and do not constitute, financial, investment, trading, or other types of advice or recommendations supplied or endorsed by TradingView. Read more in the Terms of Use.
(Services:✔️ JOIN Telegram channel
t.me/+BLfaeRJ48BBmNjM8
Gold trading signals 🚀 99%
t.me/+BLfaeRJ48BBmNjM8
Join my recommended broker , link 👇
World best broker exness ✅D
one.exnesstrack.org/a/l1t1rf3p6v
t.me/+BLfaeRJ48BBmNjM8
Gold trading signals 🚀 99%
t.me/+BLfaeRJ48BBmNjM8
Join my recommended broker , link 👇
World best broker exness ✅D
one.exnesstrack.org/a/l1t1rf3p6v
Related publications
Disclaimer
The information and publications are not meant to be, and do not constitute, financial, investment, trading, or other types of advice or recommendations supplied or endorsed by TradingView. Read more in the Terms of Use.