Hi Traders!
The market is in an overall Downtrend.
In this analysis, we want to take a closer look to the weekly, daily, H4 and H1-Timeframe.
Let's start with the weekly TF:

We here have a Falling Wedge Pattern.
As you can see, the market broke out of the important weekly Support at 104.500.
The next Target for the Downtrend-Continuation is the Level at 101.200.
Let's continue with the daily Timeframe:

On this Timeframe, we can take a closer look to the situation in the wedge.
The market made two Triangle Patterns and broke both of them bearish.
Now it is moving between the blue dotted daily Resistance and the upper Trendline.
We also marked up two Target Levels:
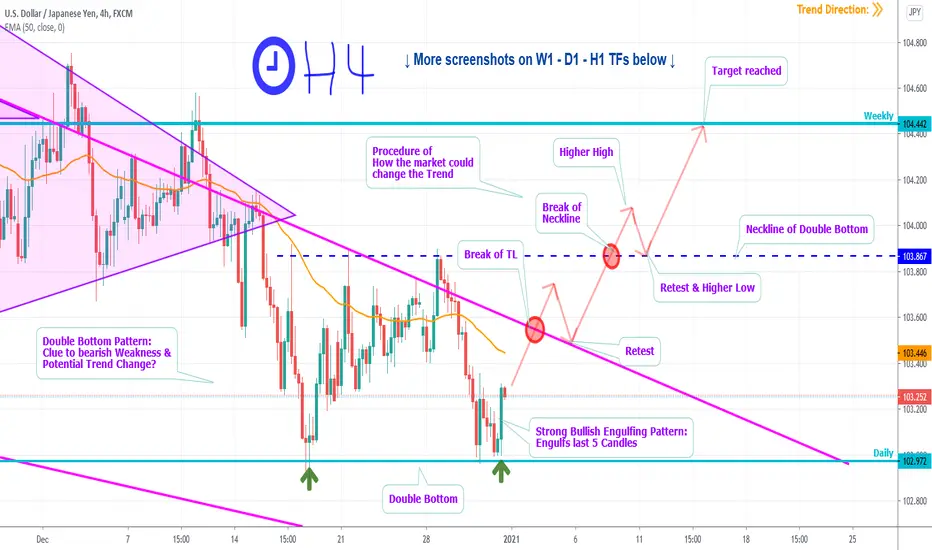
Let's continue with the H4-TF:

Now we come to the intereting part, where some things confluence with each other.
First of all, what do we need for a Downtrend?
Lower Lows and Lower Highs, right?!
So, instead of a Lower Low, we here had a Low on the same Level as before.
That means, that the market rejected a lower Price.
That is the first clue for a potential Trend Change.
Now let's go on.
The market made two Lows at the same Level.
So it is very likely to be a Double Bottom Pattern.
Many Traders feel easy to recognize this pattern.
That means, that this is an obvious Pattern and obvious Weakness.
In addition, let's consider Price Action.
The last green Bar has a the same Range from High to Low as the last 5 candles summed up.
It "engulfs" the last 5 candles bullish, so it is a typical bullish Engulfing Pattern.
We here have another clue for bullish Strength.
Lastly, the Neckline and the descending Trendline aren't far away from each other.
That means, that if the market breaks one, it is not very hard to break the other Level too.
In the chart you can see a possible Procedur of how the market could reverse and change the Trend.
It is a row of Breakouts and Retests.
Lastly, here is the H1-TF:

As you can see, we here have additional to the Double Bottom on the higher Timeframe here another Double Bottom too.
The market even broke the descending Trendline before.
The Entry Trigger for trading the Double Bottom Pattern is the bullish Break of the Neckline.
It is possible to devide the TP into several Key Structure Levels.
The SL should be below the recent Low.
We recommend to trade with low risk, because we trade against the big Trend.
Thanks and successful Trading :)!
The market is in an overall Downtrend.
In this analysis, we want to take a closer look to the weekly, daily, H4 and H1-Timeframe.
Let's start with the weekly TF:
We here have a Falling Wedge Pattern.
As you can see, the market broke out of the important weekly Support at 104.500.
The next Target for the Downtrend-Continuation is the Level at 101.200.
Let's continue with the daily Timeframe:
On this Timeframe, we can take a closer look to the situation in the wedge.
The market made two Triangle Patterns and broke both of them bearish.
Now it is moving between the blue dotted daily Resistance and the upper Trendline.
We also marked up two Target Levels:
- The bearish Target at 101.200.
That's for the case that the market continues its Trend. - The bullish Target at 104.500.
That's for the case that the market makes a big either a Pullback or changes the Trend.
Let's continue with the H4-TF:
Now we come to the intereting part, where some things confluence with each other.
First of all, what do we need for a Downtrend?
Lower Lows and Lower Highs, right?!
So, instead of a Lower Low, we here had a Low on the same Level as before.
That means, that the market rejected a lower Price.
That is the first clue for a potential Trend Change.
Now let's go on.
The market made two Lows at the same Level.
So it is very likely to be a Double Bottom Pattern.
Many Traders feel easy to recognize this pattern.
That means, that this is an obvious Pattern and obvious Weakness.
In addition, let's consider Price Action.
The last green Bar has a the same Range from High to Low as the last 5 candles summed up.
It "engulfs" the last 5 candles bullish, so it is a typical bullish Engulfing Pattern.
We here have another clue for bullish Strength.
Lastly, the Neckline and the descending Trendline aren't far away from each other.
That means, that if the market breaks one, it is not very hard to break the other Level too.
In the chart you can see a possible Procedur of how the market could reverse and change the Trend.
It is a row of Breakouts and Retests.
Lastly, here is the H1-TF:
As you can see, we here have additional to the Double Bottom on the higher Timeframe here another Double Bottom too.
The market even broke the descending Trendline before.
The Entry Trigger for trading the Double Bottom Pattern is the bullish Break of the Neckline.
It is possible to devide the TP into several Key Structure Levels.
The SL should be below the recent Low.
We recommend to trade with low risk, because we trade against the big Trend.
Thanks and successful Trading :)!
Disclaimer
The information and publications are not meant to be, and do not constitute, financial, investment, trading, or other types of advice or recommendations supplied or endorsed by TradingView. Read more in the Terms of Use.
Disclaimer
The information and publications are not meant to be, and do not constitute, financial, investment, trading, or other types of advice or recommendations supplied or endorsed by TradingView. Read more in the Terms of Use.