in Daily chart :
The resistance level at 111
Broken support level
61.8% fibo retracement
Downtrend line
> Sell
Entry : 111.00
Stop : 111.30 (30 pips)
TP1 : 110.40 (60 pips)
TP2 : 109.80 (120 pips)
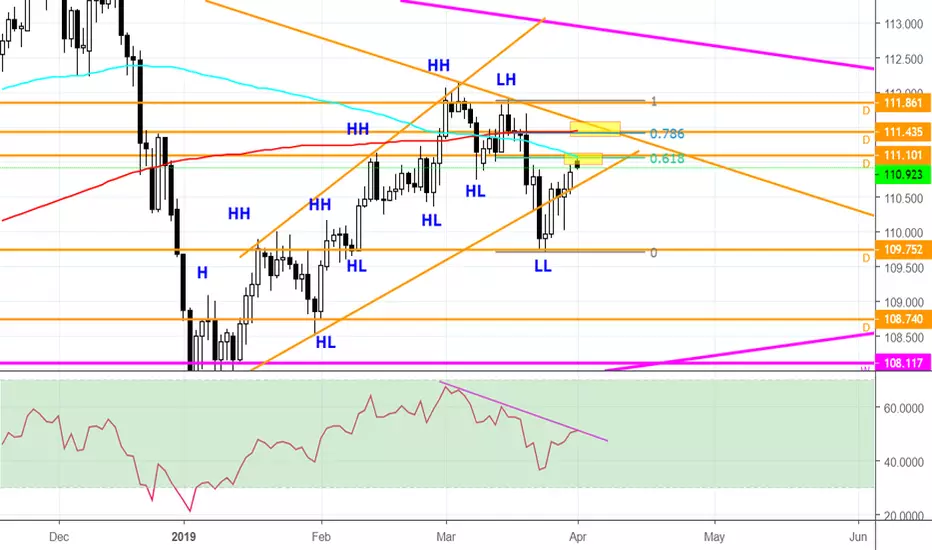
in 4H chart :
The resistance level at 111.1
Regular divergence
[img] [img]
[img]
The resistance level at 111
Broken support level
61.8% fibo retracement
Downtrend line
> Sell
Entry : 111.00
Stop : 111.30 (30 pips)
TP1 : 110.40 (60 pips)
TP2 : 109.80 (120 pips)
in 4H chart :
The resistance level at 111.1
Regular divergence
[img]
Trade active
Trade setup activatedNote
We can see shooting star and bearish pin bar at 111.00 , so we sell at a good area.[img]
Trade closed: stop reached
Profit : -30 pipsBut we can look for another sell dealing downtrend line in daily chart and 78.6% of fibo retracement.
Entry : 111.42
Stop : 111.75 (33 pip)
TP1 : 110.5 (90 pips)
TP2 : 109.8 (160 pips)
[img]
Note
Regular divergence in 4H chart. Lower price but higher RSI.
Overbought in RSI indicator
[img]
Disclaimer
The information and publications are not meant to be, and do not constitute, financial, investment, trading, or other types of advice or recommendations supplied or endorsed by TradingView. Read more in the Terms of Use.
Disclaimer
The information and publications are not meant to be, and do not constitute, financial, investment, trading, or other types of advice or recommendations supplied or endorsed by TradingView. Read more in the Terms of Use.