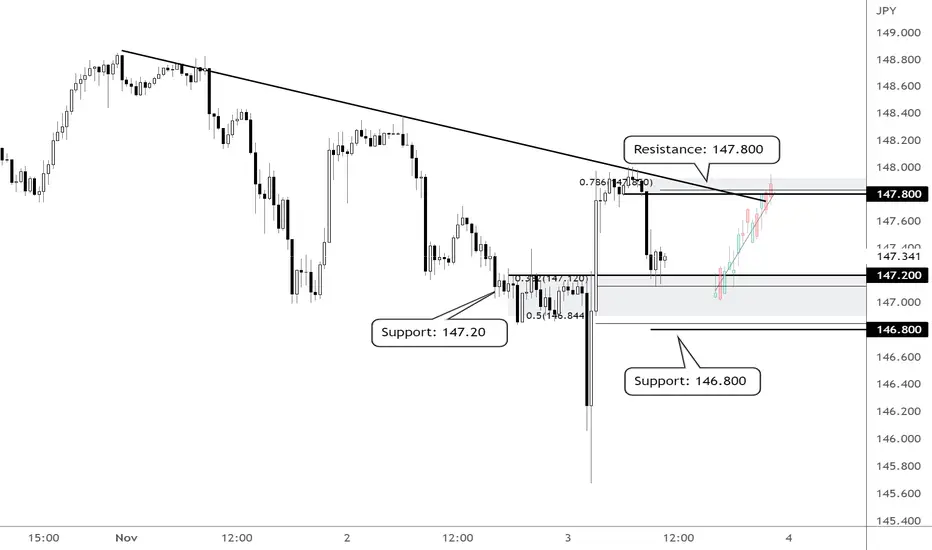
On the M30 time frame, prices are testing the support zone at 147.20, in line with the 38.2% Fibonacci level where we could see further upside to the resistance zone at 147.80. The 147.80 resistance zone coincides with the graphical resistance, descending trend line and 78.6% Fibonacci retracement. Failure to hold above the support zone at 147.20 could see prices push lower to test the next support zone at 146.80.
Disclaimer
The information and publications are not meant to be, and do not constitute, financial, investment, trading, or other types of advice or recommendations supplied or endorsed by TradingView. Read more in the Terms of Use.
Disclaimer
The information and publications are not meant to be, and do not constitute, financial, investment, trading, or other types of advice or recommendations supplied or endorsed by TradingView. Read more in the Terms of Use.