SMC Trading point update
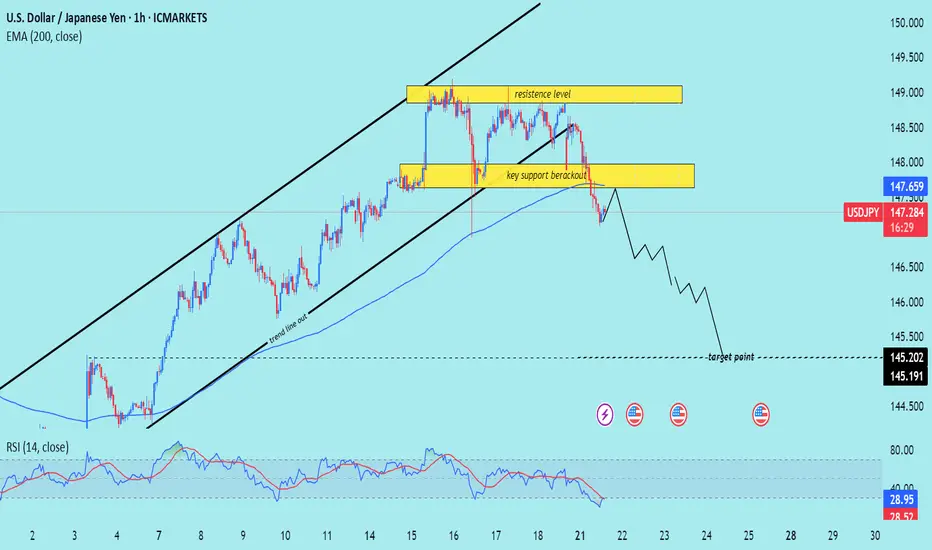
Technical analysis of USD/JPY on the 1-hour timeframe, signaling a potential drop toward the 145.200 – 145.191 target zone. Here's the detailed breakdown:
---
Technical Analysis – USD/JPY (1H)
1. Rising Channel Breakdown
Price has broken below an ascending channel, confirming a trend line breakout and signaling a trend shift from bullish to bearish.
The trend line cut and rejection from the upper resistance zone support the bearish reversal.
2. Key Support Breakout
A crucial horizontal support zone around 147.80–148.00 was broken.
The break-and-retest of this area (yellow box) acts as a confirmation of bearish momentum continuation.
3. Bearish Momentum Below EMA
Price is trading below the 200 EMA (147.659) — a strong signal of downward bias on this timeframe.
The EMA has flipped from dynamic support to resistance.
4. RSI Oversold but Bearish
RSI is at 29.41, in oversold territory, which may hint at a short-term bounce.
However, the broader structure suggests more downside potential before a deeper retracement.
5. Target Projection
Projected target zone is between 145.200–145.191, aligning with previous structure lows and likely liquidity zone.
Mr SMC Trading point
Summary
Bias: Bearish
Current Price: 147.307
Key Resistance: 147.80–148.60 zone
Structure: Rising channel break + key support breakout
200 EMA: Above price (bearish signal)
RSI: 29.41 – oversold but momentum remains bearish
Target: 145.200–145.191
Please support boost 🚀 this analysis)
Trade active
(Services:✔️ JOIN Telegram channel
t.me/SMCTrading_point
Gold trading signals 🚀 99%
t.me/SMCTrading_point
Join my recommended broker , link 👇
World best broker exness ✅D
one.exnesstrack.org/a/l1t1rf3p6v
t.me/SMCTrading_point
Gold trading signals 🚀 99%
t.me/SMCTrading_point
Join my recommended broker , link 👇
World best broker exness ✅D
one.exnesstrack.org/a/l1t1rf3p6v
Related publications
Disclaimer
The information and publications are not meant to be, and do not constitute, financial, investment, trading, or other types of advice or recommendations supplied or endorsed by TradingView. Read more in the Terms of Use.