USDJPY Trade Idea & Analysis
Chart Context:
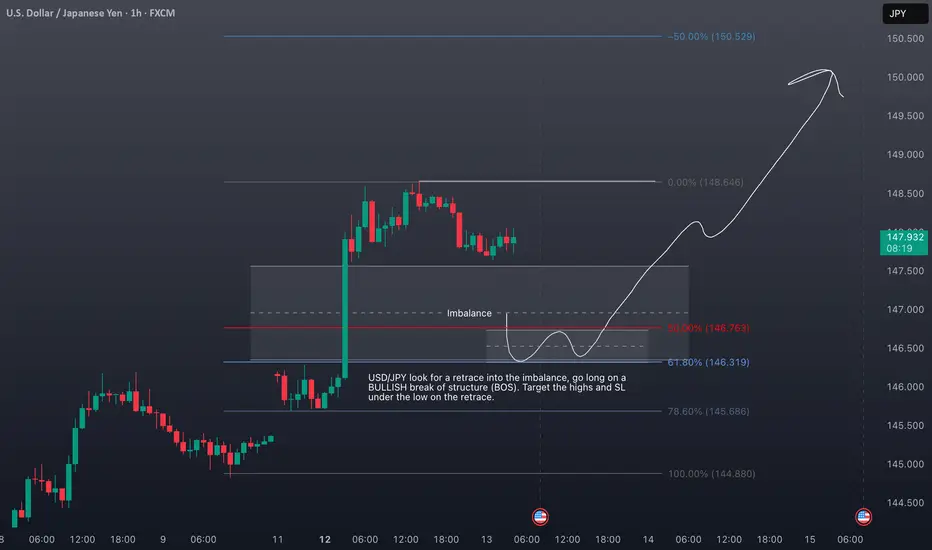
The 1H USDJPY chart shows a strong bullish impulse, followed by a consolidation and a potential retracement into a clear imbalance zone (highlighted between the 50% and 61.8% Fibonacci retracement levels, around 146.76–146.32). The market structure remains bullish, with higher highs and higher lows.
Market Fundamentals & Sentiment (as of May 2025):
USD Strength: The US dollar remains supported by persistent inflation and the Fed’s hawkish stance, with markets pricing in the possibility of further rate hikes or a prolonged period of higher rates.
JPY Weakness: The Bank of Japan continues its ultra-loose monetary policy, with no immediate signs of tightening. This divergence keeps upward pressure on USDJPY.
Risk Sentiment: Global risk appetite is stable, favoring carry trades and supporting USDJPY upside.
Trade Plan:
Look for a retrace into the imbalance zone (146.76–146.32). Enter long on a confirmed bullish break of structure (BOS) on lower timeframes. Target the recent swing highs (148.65 and above), with a stop loss below the retracement low.
Not financial advice.
Chart Context:
The 1H USDJPY chart shows a strong bullish impulse, followed by a consolidation and a potential retracement into a clear imbalance zone (highlighted between the 50% and 61.8% Fibonacci retracement levels, around 146.76–146.32). The market structure remains bullish, with higher highs and higher lows.
Market Fundamentals & Sentiment (as of May 2025):
USD Strength: The US dollar remains supported by persistent inflation and the Fed’s hawkish stance, with markets pricing in the possibility of further rate hikes or a prolonged period of higher rates.
JPY Weakness: The Bank of Japan continues its ultra-loose monetary policy, with no immediate signs of tightening. This divergence keeps upward pressure on USDJPY.
Risk Sentiment: Global risk appetite is stable, favoring carry trades and supporting USDJPY upside.
Trade Plan:
Look for a retrace into the imbalance zone (146.76–146.32). Enter long on a confirmed bullish break of structure (BOS) on lower timeframes. Target the recent swing highs (148.65 and above), with a stop loss below the retracement low.
Not financial advice.
👀 🚀 BUY/SELL SIGNALS INDICATORS THAT CUT THROUGH VOLATILITY WITH PRECISION 🔥💰
🔗 youtu.be/N1ZBqc4VA3U
👀 👉Join Our DISCORD For MORE Trade Ideas & Info:
🔗 discord.com/invite/PcBeCdwVQq
🔗 youtu.be/N1ZBqc4VA3U
👀 👉Join Our DISCORD For MORE Trade Ideas & Info:
🔗 discord.com/invite/PcBeCdwVQq
Disclaimer
The information and publications are not meant to be, and do not constitute, financial, investment, trading, or other types of advice or recommendations supplied or endorsed by TradingView. Read more in the Terms of Use.