According to my GANN-based time analysis, this month is divided into 2 major intervals, and each third is further split into 1 secondary zone, then into 6 micro zones.
Each of these micro-zones is divided into 3 equal slices, and each slice into 2 smaller zones — like cutting a cake into precise pieces.
This granular structure helps anticipate key reversal points based purely on time.
Open chart and click "make it mine" to and travel through the timeframes to understand
🔓 witness the art.
🎯 Every candle tells a story.
⏱️ Every line marks a time-based turning point.
💥 This is not just analysis — it’s precision timing.
🖼️ Click the chart and explore the masterpiece.
Let the market reveal its rhythm.
---
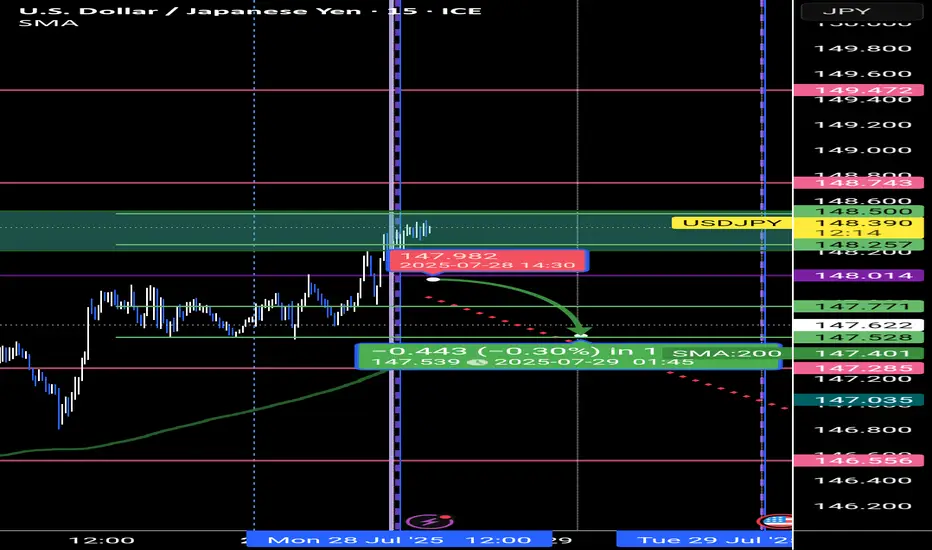
🎯 Key Levels
Pivot Point of the Week: 148.014
If price stays below, I expect a decline toward 145.098
My main time anchor to start measuring from is the price level 139.266
---
🧠 Strategy Note:
We don’t predict where the price "might go."
We react only when the price meets a defined time interval — because in most cases, price reacts precisely at those time moments.
if the price reach 148.743 and a 15min candle break it or closed completely above it then we may watch usd/jpy near 150.201
---
🟡 Live Setup:
On the chart below, we already had several reactions around key time intervals (highlighted). I’m monitoring closely to ride any impulsive move post-time-crossing.
No indicators. No clutter. Just price + time + behavior.
Each of these micro-zones is divided into 3 equal slices, and each slice into 2 smaller zones — like cutting a cake into precise pieces.
This granular structure helps anticipate key reversal points based purely on time.
Open chart and click "make it mine" to and travel through the timeframes to understand
🔓 witness the art.
🎯 Every candle tells a story.
⏱️ Every line marks a time-based turning point.
💥 This is not just analysis — it’s precision timing.
🖼️ Click the chart and explore the masterpiece.
Let the market reveal its rhythm.
---
🎯 Key Levels
Pivot Point of the Week: 148.014
If price stays below, I expect a decline toward 145.098
My main time anchor to start measuring from is the price level 139.266
---
🧠 Strategy Note:
We don’t predict where the price "might go."
We react only when the price meets a defined time interval — because in most cases, price reacts precisely at those time moments.
if the price reach 148.743 and a 15min candle break it or closed completely above it then we may watch usd/jpy near 150.201
---
🟡 Live Setup:
On the chart below, we already had several reactions around key time intervals (highlighted). I’m monitoring closely to ride any impulsive move post-time-crossing.
No indicators. No clutter. Just price + time + behavior.
Disclaimer
The information and publications are not meant to be, and do not constitute, financial, investment, trading, or other types of advice or recommendations supplied or endorsed by TradingView. Read more in the Terms of Use.
Disclaimer
The information and publications are not meant to be, and do not constitute, financial, investment, trading, or other types of advice or recommendations supplied or endorsed by TradingView. Read more in the Terms of Use.