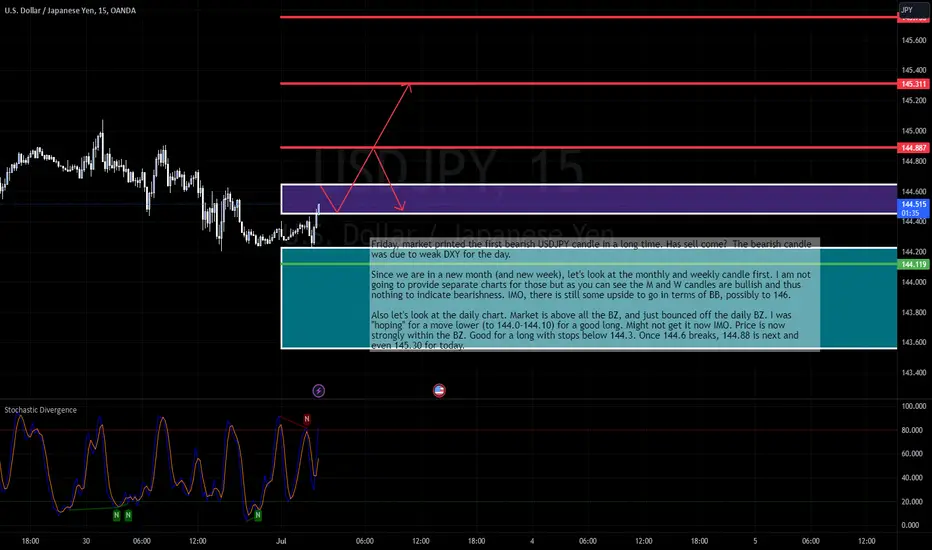
Friday, market printed the first bearish USDJPY candle in a long time. Has sell come? The bearish candle was due to weak DXY for the day.
Since we are in a new month (and new week), let's look at the monthly and weekly candle first. I am not going to provide separate charts for those but as you can see the M and W candles are bullish and thus nothing to indicate bearishness. IMO, there is still some upside to go in terms of BB, possibly to 146.
Also let's look at the daily chart. Market is above all the BZ, and just bounced off the daily BZ. I was "hoping" for a move lower (to 144.0-144.10) for a good long. Might not get it now IMO. Price is now strongly within the BZ. Good for a long with stops below 144.3. Once 144.6 breaks, 144.88 is next and even 145.30 for today.
Join me for free on Patreon (patreon.com/fademeifyoucan) to receive my daily FX and indices trading plan. DM me to join my new group to learn all my trading levels and to trade together.
Disclaimer
The information and publications are not meant to be, and do not constitute, financial, investment, trading, or other types of advice or recommendations supplied or endorsed by TradingView. Read more in the Terms of Use.