Hello Traders,
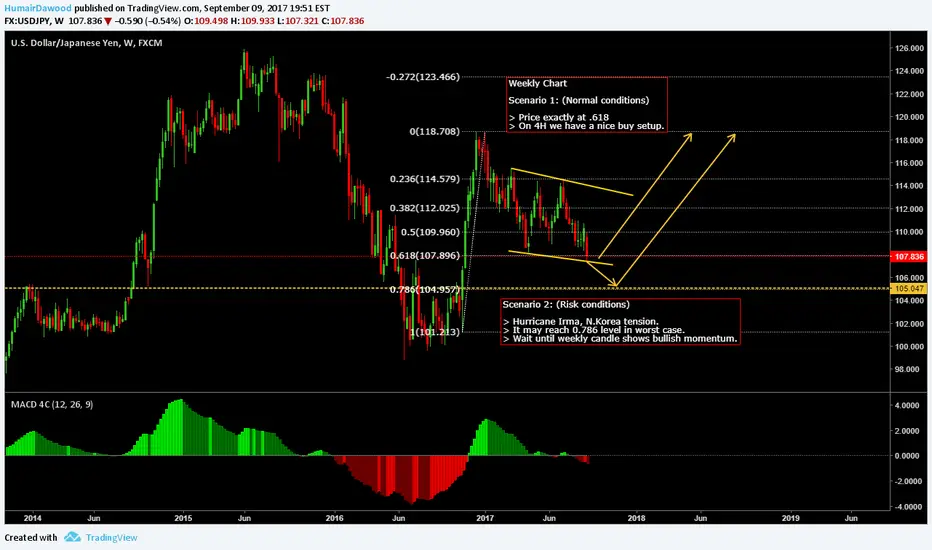
Weekly Chart
Scenario 1: (Normal conditions)
> Price exactly at .618
> On 4H we have a nice buy setup.
Scenario 2: (Risk conditions)
> Hurricane Irma, N.Korea tension.
> It may reach 0.786 level in worst case.
> Wait until weekly candle shows bullish momentum.
I rely on both technical and fundamental analysis and use my strategy to trade, you have to apply your own method to trade this.
Good luck & Trade with care
Thanks!
Note
300 + pips, still going strong (Y)Note
Looking for second entryTrade closed: target reached
Note
Great we now look for pull backs to continue to buy ) good luck!Disclaimer
The information and publications are not meant to be, and do not constitute, financial, investment, trading, or other types of advice or recommendations supplied or endorsed by TradingView. Read more in the Terms of Use.
Disclaimer
The information and publications are not meant to be, and do not constitute, financial, investment, trading, or other types of advice or recommendations supplied or endorsed by TradingView. Read more in the Terms of Use.