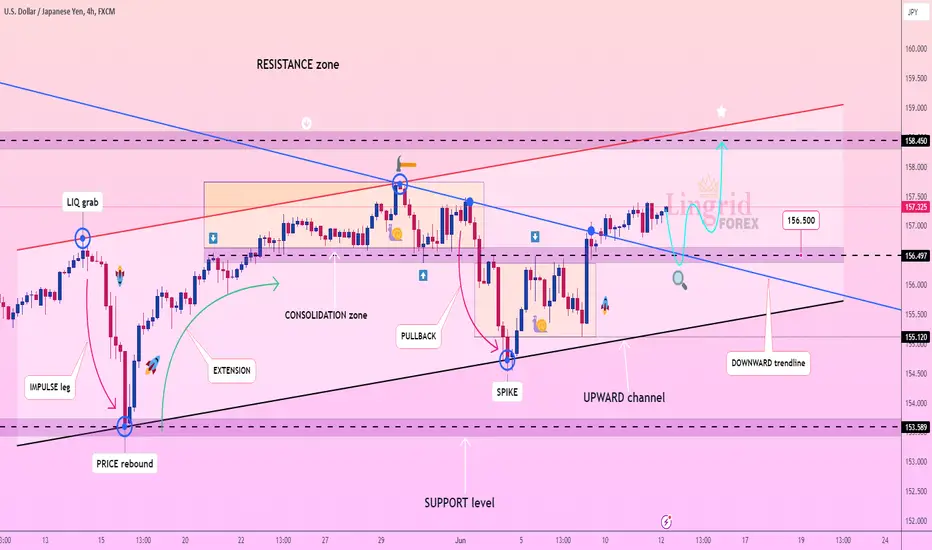
The daily chart is displaying a strong uptrend, with the 
 USDJPY having recently broken and closed above a previously tested level. This significant breach was marked by a large bullish candle, indicating that the level has gained importance. The price action had earlier formed a triangle pattern, which was eventually broken through. On the daily chart, the market is now approaching a strong resistance zone where we witnessed a massive sell-off. I'm anticipating a retest of the support level and confirmation of buying momentum before making any further moves. My target is resistance zone at 158.450
Traders, if you liked this idea or if you have your own opinion about it, write in the comments. I will be glad 👩💻
Traders, if you liked this idea or if you have your own opinion about it, write in the comments. I will be glad 👩💻
💰FREE FOREX signals in Telegram: bit.ly/3F4mrMi
🚀FREE CRYPTO signals in Telegram: t.me/cryptolingrid
🌎WebSite: lingrid.org
🚀FREE CRYPTO signals in Telegram: t.me/cryptolingrid
🌎WebSite: lingrid.org
Disclaimer
The information and publications are not meant to be, and do not constitute, financial, investment, trading, or other types of advice or recommendations supplied or endorsed by TradingView. Read more in the Terms of Use.