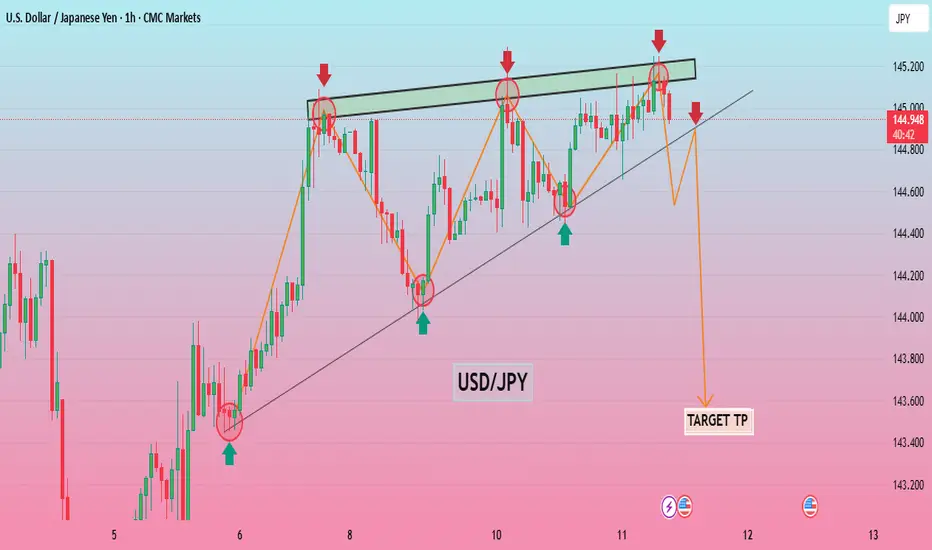
This chart illustrates a USD/JPY (U.S. Dollar / Japanese Yen) price action setup on the 1-hour timeframe with a potential bearish reversal pattern forming.
Key Observations:
1. Rising Wedge Pattern:
The price is moving within a narrowing range (highlighted by the two converging trendlines).
A series of higher highs and higher lows is visible, but momentum appears to be weakening.
2. Rejection at Resistance (Red Arrows):
Several attempts to break the upper resistance line failed.
Each red arrow indicates strong selling pressure at those peaks.
3. Support Zone (Green Arrows):
The lower trendline (acting as support) was tested multiple times and held—until now.
4. Breakdown Anticipated:
The orange path suggests a projected move downward if the wedge breaks.
The price has started to move below the wedge, signaling a possible breakdown.
5. Target TP (Take Profit):
Marked at around 143.600, based on the height of the wedge or past support zones.
This target aligns with prior swing lows, making it a reasonable objective.
---
Interpretation:
The chart anticipates a bearish reversal from the rising wedge pattern.
A short position might be considered on confirmation of the breakdown with stops above the last swing high (~145.200).
Traders are targeting a move to the 143.600 area.
Let me know if you want help analyzing this trade idea further or need other timeframes or indicators added.
Disclaimer
The information and publications are not meant to be, and do not constitute, financial, investment, trading, or other types of advice or recommendations supplied or endorsed by TradingView. Read more in the Terms of Use.
Disclaimer
The information and publications are not meant to be, and do not constitute, financial, investment, trading, or other types of advice or recommendations supplied or endorsed by TradingView. Read more in the Terms of Use.