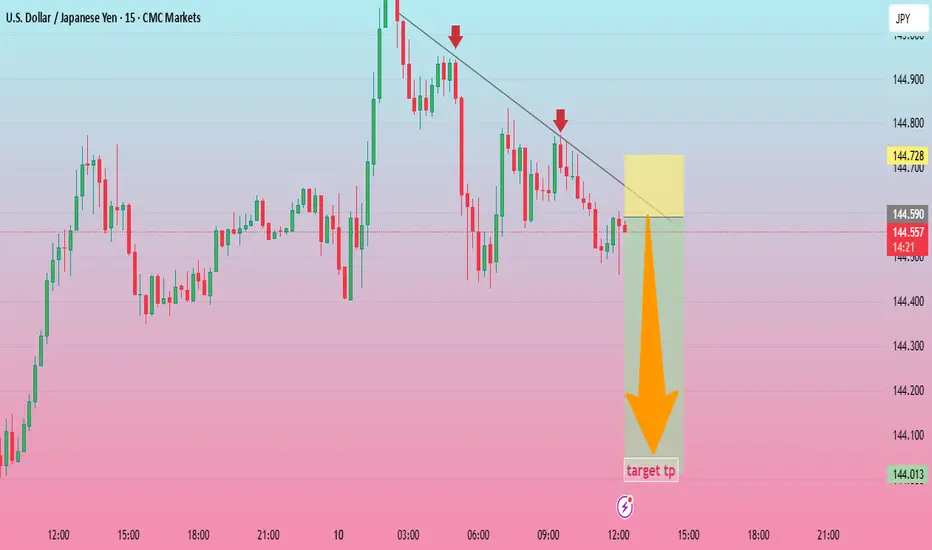
It seems you've uploaded a chart image. This is a TradingView chart showing the U.S. Dollar/Japanese Yen (USD/JPY) pair on a 15-minute timeframe. The chart includes a potential sell setup based on a descending trendline and shows a target price zone with a directional arrow indicating a potential price drop.
Would you like to discuss this chart in more detail, or do you have specific questions about it?
Would you like to discuss this chart in more detail, or do you have specific questions about it?
Disclaimer
The information and publications are not meant to be, and do not constitute, financial, investment, trading, or other types of advice or recommendations supplied or endorsed by TradingView. Read more in the Terms of Use.
Disclaimer
The information and publications are not meant to be, and do not constitute, financial, investment, trading, or other types of advice or recommendations supplied or endorsed by TradingView. Read more in the Terms of Use.