📊 Pattern & Structure:
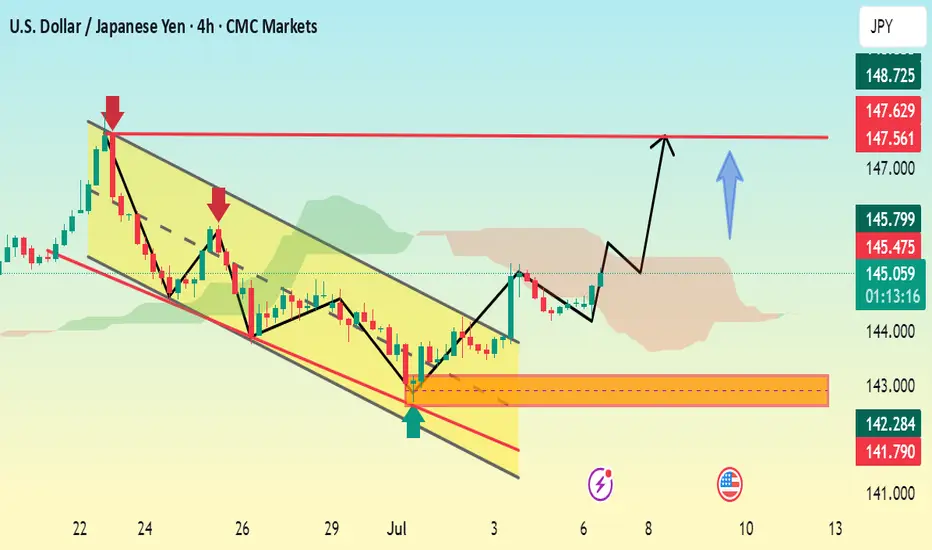
The chart shows a downward channel (falling wedge) pattern that has recently been broken to the upside, indicating a bullish breakout.
The breakout is clean, with a sharp upward move, confirming the reversal from the bearish trend.
🔍 Key Levels Identified:
Support Zone:
142.284 – 141.790 (marked with an orange box)
This zone acted as a strong demand/support area.
Price bounced strongly after reaching this zone.
Immediate Resistance Levels:
145.799 – Near-term resistance.
147.000 – 147.629 – Key resistance zone (highlighted with a red horizontal line).
148.725 – Final bullish target/resistance on the chart.
📈 Bullish Scenario (highlighted with arrows and wave projection):
Price has broken out of the falling wedge, retested, and is pushing higher.
Target zone: 147.000–148.725.
The chart suggests a bullish projection, with further gains expected if the price sustains above 145.47.
📲 Join telegram channel free ..
t.me/docter_Pips_official05
Forex, Gold & Crypto Signals with detailed analysis & get consistent results..
t.me/docter_Pips_official05
Gold Signal's with proper TP & SL for high profit.
t.me/docter_Pips_official05
Forex, Gold & Crypto Signals with detailed analysis & get consistent results..
t.me/docter_Pips_official05
Gold Signal's with proper TP & SL for high profit.
Disclaimer
The information and publications are not meant to be, and do not constitute, financial, investment, trading, or other types of advice or recommendations supplied or endorsed by TradingView. Read more in the Terms of Use.