In FX markets, the USDJPY currency pair has moved more than most this week. Initially trading higher, rocked by President Trump’s unveiling of the tariff letter sent to Japan on Tuesday in a social media show outlining new tariffs on Japanese imports of 25%, supported by rising US 10 year treasury yields (+10 bps on week), which often can influence USDJPY prices, and a general squeeze on weak short US dollar positions across all G7/10 currency pairs. This all helped USDJPY to move from Monday’s opening level around 144.40 up to a 3-week high of 147.18 on Wednesday.
Then it was all change as USDJPY ran into a wave of fresh selling as traders took advantage of the squeeze to reopen short positions at higher levels, especially with various Bank of Japan board members discussing the potential for the Japanese central bank to raise interest rates again at some stage later in the year, and then President Trump unveiling more aggressive tariffs on countries such as Brazil (50% tariff), which renewed trader concerns that the US economy may be more negatively impacted by his trade policies. This sent USDJPY to a low of 145.75 this morning before recovering to slightly higher levels (146.25 0700 BST).
Looking forward, trade deals and Trump tariff headlines/social media posts may continue to influence where USDJPY moves into the Friday close, as could the technical outlook ahead of a busy week for scheduled events started on Monday July 14th.
Technical Update: USDJPY Back to Important Resistance?
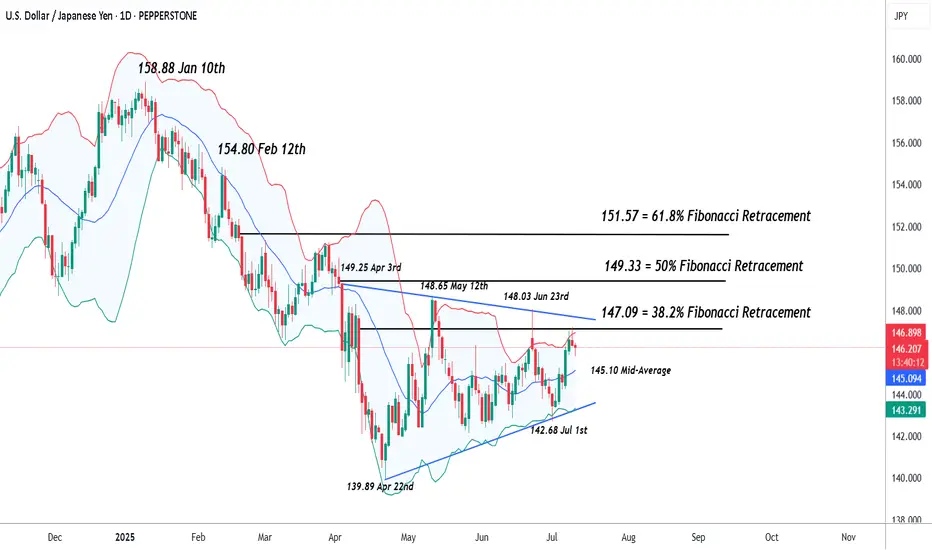
Since posting the 142.68 July 1st low, USDJPY has rallied strongly, seeing a more than 3% recovery in 6 sessions. This may mean some traders are looking for a more sustained price advance, but as the chart below shows, the latest price strength might only now be back to a resistance focus between the 147.09/147.64 levels.

These levels are equal to a combination of the 38.2% Fibonacci retracement of the January 10th to April 22nd decline at 147.09, and the downtrend that connects the highs seen on April 3rd, May 12th and June 23rd, which currently stands at 147.64. So far at least, this resistance area has capped the latest price strength.
Much will depend on future market sentiment and price trends, but it's possible closing breaks above the 147.09/64 resistance range may be required to suggest potential for a further phase of price strength towards 149.33, the higher 50%, even 151.57 the 61.8% retracements.
What if Resistance at 147.09/64 Continues to Hold?
Of course, the 147.09/64 resistance is currently holding price strength and could even prompt fresh weakness. As such, it could be suggested a more balanced sideways trading range is currently in place, with the latest price strength now back to the upper limit resistance at 147.09/64 .
If this is the case, it is possible price weakness might now emerge, with closing breaks under support at 145.10, the Bollinger mid-average, potentially suggesting further declines are possible towards 143.20, which is the uptrend connecting the recent lows, which also possibly marks the lower limits of the current sideways price range.
The material provided here has not been prepared accordance with legal requirements designed to promote the independence of investment research and as such is considered to be a marketing communication. Whilst it is not subject to any prohibition on dealing ahead of the dissemination of investment research, we will not seek to take any advantage before providing it to our clients.
Pepperstone doesn’t represent that the material provided here is accurate, current or complete, and therefore shouldn’t be relied upon as such. The information, whether from a third party or not, isn’t to be considered as a recommendation; or an offer to buy or sell; or the solicitation of an offer to buy or sell any security, financial product or instrument; or to participate in any particular trading strategy. It does not take into account readers’ financial situation or investment objectives. We advise any readers of this content to seek their own advice. Without the approval of Pepperstone, reproduction or redistribution of this information isn’t permitted.
Then it was all change as USDJPY ran into a wave of fresh selling as traders took advantage of the squeeze to reopen short positions at higher levels, especially with various Bank of Japan board members discussing the potential for the Japanese central bank to raise interest rates again at some stage later in the year, and then President Trump unveiling more aggressive tariffs on countries such as Brazil (50% tariff), which renewed trader concerns that the US economy may be more negatively impacted by his trade policies. This sent USDJPY to a low of 145.75 this morning before recovering to slightly higher levels (146.25 0700 BST).
Looking forward, trade deals and Trump tariff headlines/social media posts may continue to influence where USDJPY moves into the Friday close, as could the technical outlook ahead of a busy week for scheduled events started on Monday July 14th.
Technical Update: USDJPY Back to Important Resistance?
Since posting the 142.68 July 1st low, USDJPY has rallied strongly, seeing a more than 3% recovery in 6 sessions. This may mean some traders are looking for a more sustained price advance, but as the chart below shows, the latest price strength might only now be back to a resistance focus between the 147.09/147.64 levels.
These levels are equal to a combination of the 38.2% Fibonacci retracement of the January 10th to April 22nd decline at 147.09, and the downtrend that connects the highs seen on April 3rd, May 12th and June 23rd, which currently stands at 147.64. So far at least, this resistance area has capped the latest price strength.
Much will depend on future market sentiment and price trends, but it's possible closing breaks above the 147.09/64 resistance range may be required to suggest potential for a further phase of price strength towards 149.33, the higher 50%, even 151.57 the 61.8% retracements.
What if Resistance at 147.09/64 Continues to Hold?
Of course, the 147.09/64 resistance is currently holding price strength and could even prompt fresh weakness. As such, it could be suggested a more balanced sideways trading range is currently in place, with the latest price strength now back to the upper limit resistance at 147.09/64 .
If this is the case, it is possible price weakness might now emerge, with closing breaks under support at 145.10, the Bollinger mid-average, potentially suggesting further declines are possible towards 143.20, which is the uptrend connecting the recent lows, which also possibly marks the lower limits of the current sideways price range.
The material provided here has not been prepared accordance with legal requirements designed to promote the independence of investment research and as such is considered to be a marketing communication. Whilst it is not subject to any prohibition on dealing ahead of the dissemination of investment research, we will not seek to take any advantage before providing it to our clients.
Pepperstone doesn’t represent that the material provided here is accurate, current or complete, and therefore shouldn’t be relied upon as such. The information, whether from a third party or not, isn’t to be considered as a recommendation; or an offer to buy or sell; or the solicitation of an offer to buy or sell any security, financial product or instrument; or to participate in any particular trading strategy. It does not take into account readers’ financial situation or investment objectives. We advise any readers of this content to seek their own advice. Without the approval of Pepperstone, reproduction or redistribution of this information isn’t permitted.
Global risk Warning CFDs are complex instruments and come with a high risk of losing money rapidly due to leverage. Between 74-89% of retail investor accounts lose money when trading in CFDs. You should consider whether you understand how CFD
Disclaimer
The information and publications are not meant to be, and do not constitute, financial, investment, trading, or other types of advice or recommendations supplied or endorsed by TradingView. Read more in the Terms of Use.