🔹USD/JPY Technical Analysis - 1H Chart
▪️Trend Reversal Confirmed
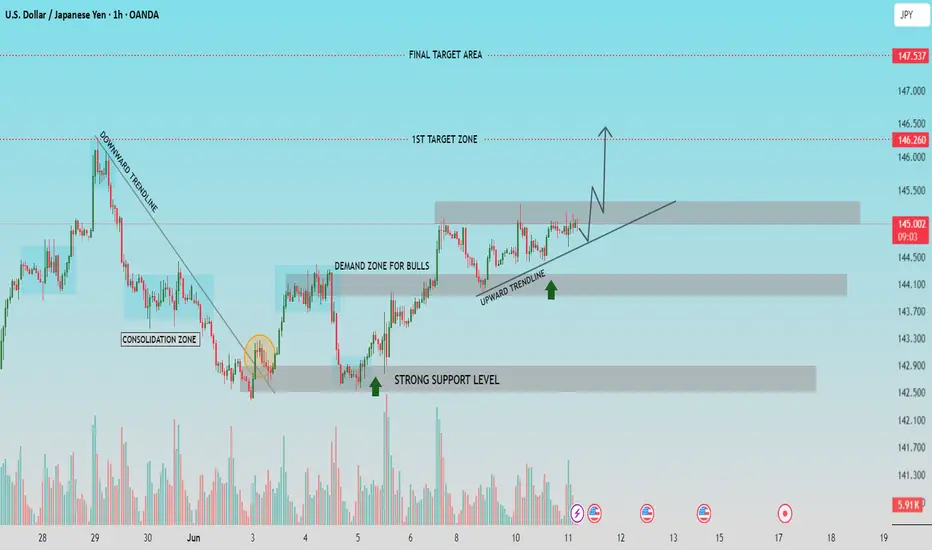
The pair has broken out of a downward trendline, indicating a bullish reversal from the previous downtrend. This breakout occurred near a well-established strong support level around 143.00-142.50.
▪️Current Market Structure
▫️Upward trendline is being respected with higher lows forming consistently.
▫️ Price is consolidating just below the 1st target zone (around 146.260), suggesting potential for a bullish breakout continuation.
▫️Demand zone for bulls around 144.00-144.50 is acting as a key accumulation area.
▪️Key Levels to Watch
▫️Support: 144.00-144.50 (demand zone), 143.00-142.50 (strong support level)
▪️Resistance/Target Zones:
▫️ 1st Target: 146.260
▫️Final Target: 147.537
▪️Outlook
As long as price holds above the upward trendline and the demand zone, bullish momentum is likely to continue. A breakout above 146.260 may open the path toward the final target area near 147.537. Watch for volume confirmation on any breakout.
▪️Bias: Bullish
🔹Community Insight:
If you find this analysis helpful in your trading journey, feel free to share your thoughts or questions in the comments. Let’s work together to maintain a disciplined, technical approach to the markets.
▪️Follow for regular updates and trade setups.
▪️Trend Reversal Confirmed
The pair has broken out of a downward trendline, indicating a bullish reversal from the previous downtrend. This breakout occurred near a well-established strong support level around 143.00-142.50.
▪️Current Market Structure
▫️Upward trendline is being respected with higher lows forming consistently.
▫️ Price is consolidating just below the 1st target zone (around 146.260), suggesting potential for a bullish breakout continuation.
▫️Demand zone for bulls around 144.00-144.50 is acting as a key accumulation area.
▪️Key Levels to Watch
▫️Support: 144.00-144.50 (demand zone), 143.00-142.50 (strong support level)
▪️Resistance/Target Zones:
▫️ 1st Target: 146.260
▫️Final Target: 147.537
▪️Outlook
As long as price holds above the upward trendline and the demand zone, bullish momentum is likely to continue. A breakout above 146.260 may open the path toward the final target area near 147.537. Watch for volume confirmation on any breakout.
▪️Bias: Bullish
🔹Community Insight:
If you find this analysis helpful in your trading journey, feel free to share your thoughts or questions in the comments. Let’s work together to maintain a disciplined, technical approach to the markets.
▪️Follow for regular updates and trade setups.
Trade active
rejection from trendline , near demand zone..Note
last layer added at support level, Trade closed: target reached
150 pips+Related publications
Disclaimer
The information and publications are not meant to be, and do not constitute, financial, investment, trading, or other types of advice or recommendations supplied or endorsed by TradingView. Read more in the Terms of Use.
Related publications
Disclaimer
The information and publications are not meant to be, and do not constitute, financial, investment, trading, or other types of advice or recommendations supplied or endorsed by TradingView. Read more in the Terms of Use.