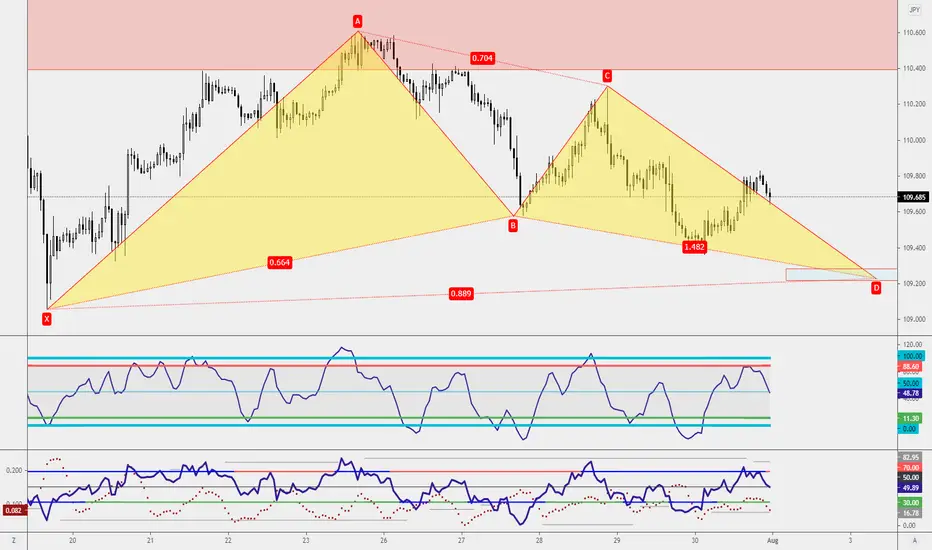
A Bullish Deep Gartley Pattern is about to emerge on the USDJPY 1-hourly chart. If you are a support and resistance trader, you might be looking for a buying opportunity at 109.41. What's more important is to wait for the candlestick confirmation before engaging on that trade.
There is at least 1 harmonic pattern on each timeframe I'm trading at, the 1-hourly chart, 4-hourly chart and the daily chart. Are you able to spot all of them?
Share your analysis on the comment box.
There is at least 1 harmonic pattern on each timeframe I'm trading at, the 1-hourly chart, 4-hourly chart and the daily chart. Are you able to spot all of them?
Share your analysis on the comment box.
🕒 15mins workday for Young Parents
🏦 Qualify Junior Analyst within 90days
🎤 Keynote Speaker
Get into our 15mins workday community
discord.gg/AKDr9vPqH7
Live session & Trading Tips on the GO
instagram.com/raynlim/
🏦 Qualify Junior Analyst within 90days
🎤 Keynote Speaker
Get into our 15mins workday community
discord.gg/AKDr9vPqH7
Live session & Trading Tips on the GO
instagram.com/raynlim/
Disclaimer
The information and publications are not meant to be, and do not constitute, financial, investment, trading, or other types of advice or recommendations supplied or endorsed by TradingView. Read more in the Terms of Use.