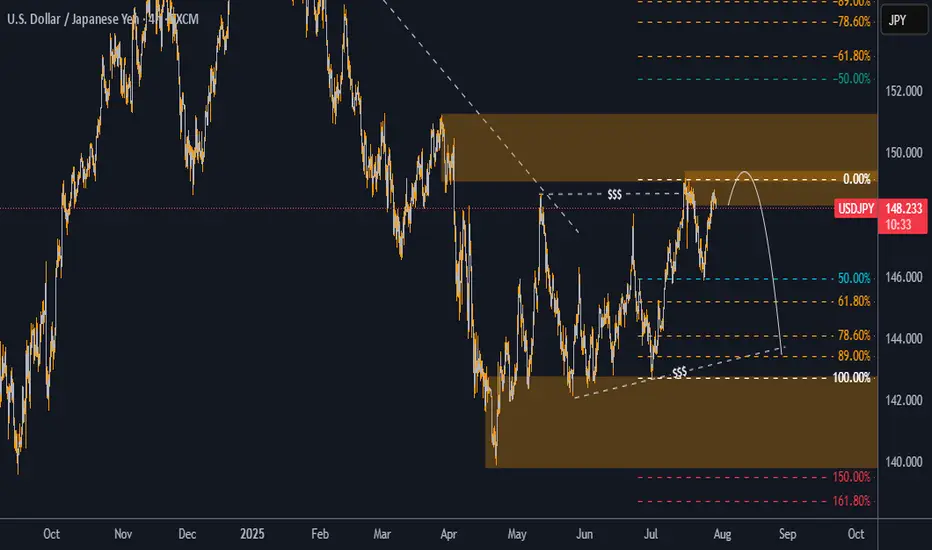
The USD/JPY pair is currently presenting a strong bearish opportunity and price action structure. As of the latest 4H chart analysis, the price has reached a well-defined supply zone around the 148.80–149.70 area. This zone aligns with a previous institutional level where price showed significant reaction, marking it as a valid area of interest for sellers.
Liquidity Grab & Rejection
The market structure remains bearish overall. Recently, price took out a cluster of liquidity above the previous highs. This liquidity sweep suggests that smart money may have accumulated short positions, preparing for a move lower.
High-Probability Sell Zone
The price is currently reacting to a premium zone near the 0% Fibonacci retracement level, drawn from the recent swing high to swing low. This zone also coincides with a previous area of imbalance and supply, reinforcing the bearish setup.
Key Bearish Targets
First Target: 145.89 — this aligns with the 50% Fibonacci retracement level and a previous structural support.
Second Target: 142.56 — this deeper target sits near the 89% Fibonacci level, close to an old demand zone where price may look to rebalance.
Summary
With trend direction biased to the downside, the pair is showing strong signs of rejection from a key supply zone after sweeping liquidity. If momentum continues, we expect USD/JPY to drop toward 145.89 initially, with an extended move possibly reaching 142.56.
Traders should monitor price action closely for further confirmations and maintain proper risk management, especially with upcoming economic catalysts that may affect the JPY.
Disclaimer
The information and publications are not meant to be, and do not constitute, financial, investment, trading, or other types of advice or recommendations supplied or endorsed by TradingView. Read more in the Terms of Use.
Disclaimer
The information and publications are not meant to be, and do not constitute, financial, investment, trading, or other types of advice or recommendations supplied or endorsed by TradingView. Read more in the Terms of Use.