Daily chart,
USDJPY
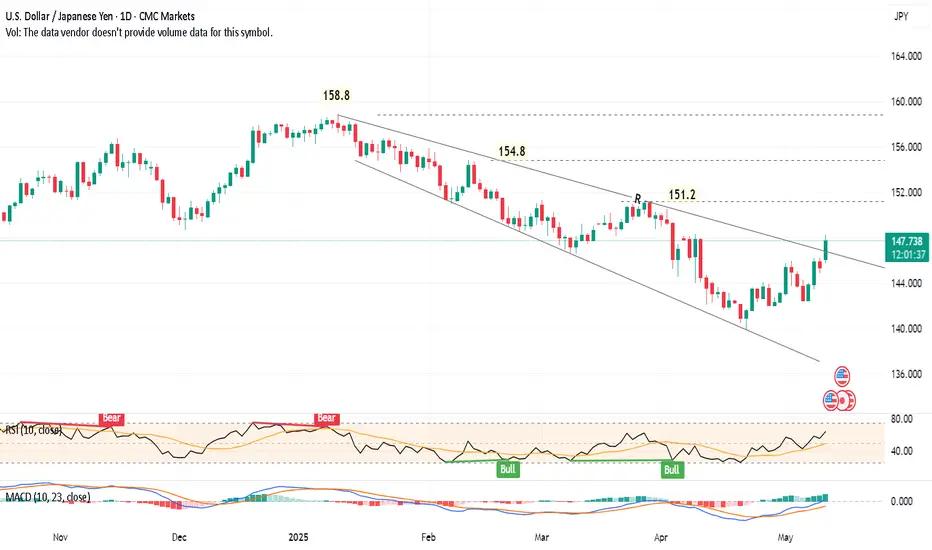
 USDJPY price is forming a falling expanding wedge pattern. After clear crossing of the line R, and stabilizing above it for 2 days, the target will be 165.5
Note that there are resistance levels on the way, especially the strong historical High (at 161.95)!
Stop loss below 145 - Consider a rising stop loss level as the price goes up.
Technical indicators:
RSI is positive
MACD is about to cross its signal line.
USDJPY
Note that there are resistance levels on the way, especially the strong historical High (at 161.95)!
Stop loss below 145 - Consider a rising stop loss level as the price goes up.
Technical indicators:
RSI is positive
MACD is about to cross its signal line.
Disclaimer
The information and publications are not meant to be, and do not constitute, financial, investment, trading, or other types of advice or recommendations supplied or endorsed by TradingView. Read more in the Terms of Use.
Disclaimer
The information and publications are not meant to be, and do not constitute, financial, investment, trading, or other types of advice or recommendations supplied or endorsed by TradingView. Read more in the Terms of Use.