If you have been reading my analysis, you might be thinking USDJPY will be alike to EURUSD or GBPUSD. Well, not this time. USDJPY is in a unique situation where the daily chart is on a bullish trend, 4-hourly chart a weaker bull(which I will not take action) and 1-hourly a bearish trend. Knowing how to identify the trend helps a trader to determine if they are trading with the trend or against the trend. This information help traders to plan their stop and target better.
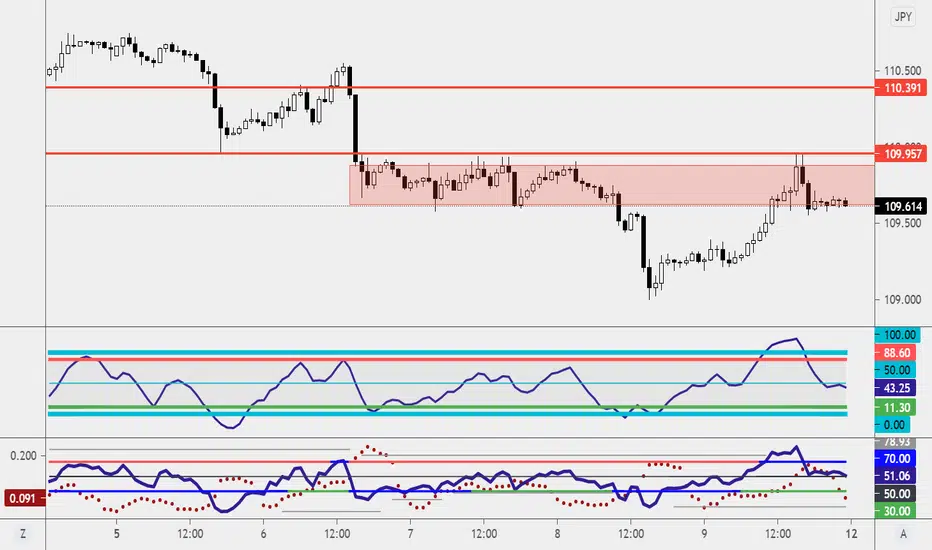
I'm waiting to short USDJPY at 109.87 as long as the trade didn't break and close above 109.95.
I'm waiting to short USDJPY at 109.87 as long as the trade didn't break and close above 109.95.
🕒 15mins workday for Young Parents
🏦 Qualify Junior Analyst within 90days
🎤 Keynote Speaker
Get into our 15mins workday community
discord.gg/AKDr9vPqH7
Live session & Trading Tips on the GO
instagram.com/raynlim/
🏦 Qualify Junior Analyst within 90days
🎤 Keynote Speaker
Get into our 15mins workday community
discord.gg/AKDr9vPqH7
Live session & Trading Tips on the GO
instagram.com/raynlim/
Related publications
Disclaimer
The information and publications are not meant to be, and do not constitute, financial, investment, trading, or other types of advice or recommendations supplied or endorsed by TradingView. Read more in the Terms of Use.