⚠️ Disruption & Counterpoints:
1. Premature Breakout Bias:
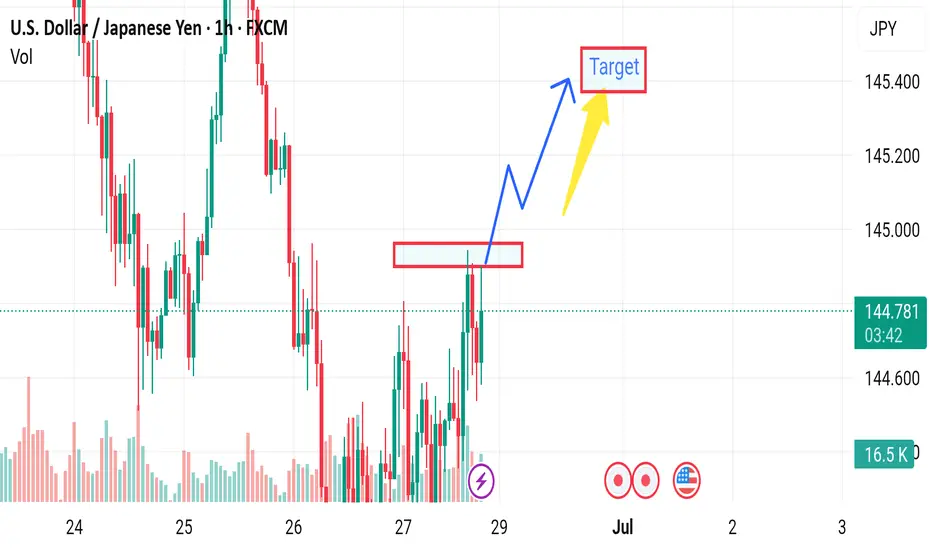
The chart shows price repeatedly rejecting the resistance zone (highlighted in red).
The arrow assumes a clean breakout without confirmation — this is speculative, as the price hasn’t closed convincingly above the resistance.
This could easily turn into a false breakout or double top if price fails again.
2. Volume Mismatch:
A breakout should be backed by strong bullish volume. However, the current volume is mixed and not showing a clear surge in buyer strength.
Lack of volume confirmation makes the breakout less reliable.
3. Ignoring Recent Rejections:
The red zone was tested multiple times in the last sessions without success. That typically signals strong supply or institutional selling.
Repeating this setup without accounting for historical failure adds downside risk.
4. Missing Bearish Scenario:
No alternate path is considered. A failed breakout could lead to a pullback toward 144.00 or lower, especially with U.S. news events (indicated by the flag).
A balanced analysis should always prepare for both breakout and rejection.
5. Macroeconomic Event Risk:
Similar to the GBP/USD chart, this one also shows an upcoming U.S. economic event. That could heavily move USD/JPY, and technical setups may become invalid fast.
The analysis ignores the need to wait for the news catalyst or confirmation after the release.
1. Premature Breakout Bias:
The chart shows price repeatedly rejecting the resistance zone (highlighted in red).
The arrow assumes a clean breakout without confirmation — this is speculative, as the price hasn’t closed convincingly above the resistance.
This could easily turn into a false breakout or double top if price fails again.
2. Volume Mismatch:
A breakout should be backed by strong bullish volume. However, the current volume is mixed and not showing a clear surge in buyer strength.
Lack of volume confirmation makes the breakout less reliable.
3. Ignoring Recent Rejections:
The red zone was tested multiple times in the last sessions without success. That typically signals strong supply or institutional selling.
Repeating this setup without accounting for historical failure adds downside risk.
4. Missing Bearish Scenario:
No alternate path is considered. A failed breakout could lead to a pullback toward 144.00 or lower, especially with U.S. news events (indicated by the flag).
A balanced analysis should always prepare for both breakout and rejection.
5. Macroeconomic Event Risk:
Similar to the GBP/USD chart, this one also shows an upcoming U.S. economic event. That could heavily move USD/JPY, and technical setups may become invalid fast.
The analysis ignores the need to wait for the news catalyst or confirmation after the release.
t.me/gold_free_signals1
𝙁𝙤𝙧𝙚𝙭 𝙩𝙧𝙖𝙙𝙞𝙣𝙜 𝙚𝙭𝙥𝙚𝙧𝙞𝙚𝙣𝙘𝙚 𝙩𝙚𝙖𝙢 ☺️ 𝙢𝙖𝙣𝙖𝙜𝙚 𝙮𝙤𝙪𝙧 𝙖𝙘𝙘𝙤𝙪𝙣𝙩 𝙢𝙖𝙠𝙞𝙣𝙜 𝙢𝙤𝙣𝙚𝙮 🤑💰
t.me/gold_free_signals1
𝙁𝙤𝙧𝙚𝙭 𝙩𝙧𝙖𝙙𝙞𝙣𝙜 𝙚𝙭𝙥𝙚𝙧𝙞𝙚𝙣𝙘𝙚 𝙩𝙚𝙖𝙢 ☺️ 𝙢𝙖𝙣𝙖𝙜𝙚 𝙮𝙤𝙪𝙧 𝙖𝙘𝙘𝙤𝙪𝙣𝙩 𝙢𝙖𝙠𝙞𝙣𝙜 𝙢𝙤𝙣𝙚𝙮 🤑💰
t.me/gold_free_signals1
Disclaimer
The information and publications are not meant to be, and do not constitute, financial, investment, trading, or other types of advice or recommendations supplied or endorsed by TradingView. Read more in the Terms of Use.
t.me/gold_free_signals1
𝙁𝙤𝙧𝙚𝙭 𝙩𝙧𝙖𝙙𝙞𝙣𝙜 𝙚𝙭𝙥𝙚𝙧𝙞𝙚𝙣𝙘𝙚 𝙩𝙚𝙖𝙢 ☺️ 𝙢𝙖𝙣𝙖𝙜𝙚 𝙮𝙤𝙪𝙧 𝙖𝙘𝙘𝙤𝙪𝙣𝙩 𝙢𝙖𝙠𝙞𝙣𝙜 𝙢𝙤𝙣𝙚𝙮 🤑💰
t.me/gold_free_signals1
𝙁𝙤𝙧𝙚𝙭 𝙩𝙧𝙖𝙙𝙞𝙣𝙜 𝙚𝙭𝙥𝙚𝙧𝙞𝙚𝙣𝙘𝙚 𝙩𝙚𝙖𝙢 ☺️ 𝙢𝙖𝙣𝙖𝙜𝙚 𝙮𝙤𝙪𝙧 𝙖𝙘𝙘𝙤𝙪𝙣𝙩 𝙢𝙖𝙠𝙞𝙣𝙜 𝙢𝙤𝙣𝙚𝙮 🤑💰
t.me/gold_free_signals1
Disclaimer
The information and publications are not meant to be, and do not constitute, financial, investment, trading, or other types of advice or recommendations supplied or endorsed by TradingView. Read more in the Terms of Use.