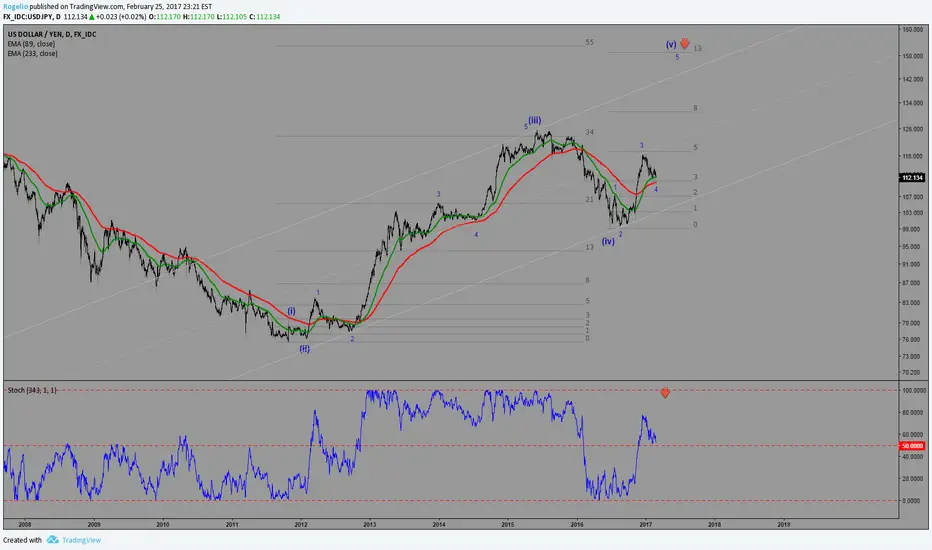
USDJPY daily chart
EMA cross is bullish
Price is inside a channel since 2012 when bull move started
If DXY dollar index can still go higher, then USDJPY coud make a new high.
We could be in wave (v), so looking for a 13/2 fibo ratio,
the target would be the top of channel around 150
Inside the wave (v), we are in a correction.
If the market turns bearish it needs to make a bearish EMA cross
Related publications
Disclaimer
The information and publications are not meant to be, and do not constitute, financial, investment, trading, or other types of advice or recommendations supplied or endorsed by TradingView. Read more in the Terms of Use.
Related publications
Disclaimer
The information and publications are not meant to be, and do not constitute, financial, investment, trading, or other types of advice or recommendations supplied or endorsed by TradingView. Read more in the Terms of Use.