This chart is a technical analysis of the USD/JPY (U.S. Dollar / Japanese Yen) currency pair on a 1-hour time frame. Here are the key details:
Chart Elements and Analysis:
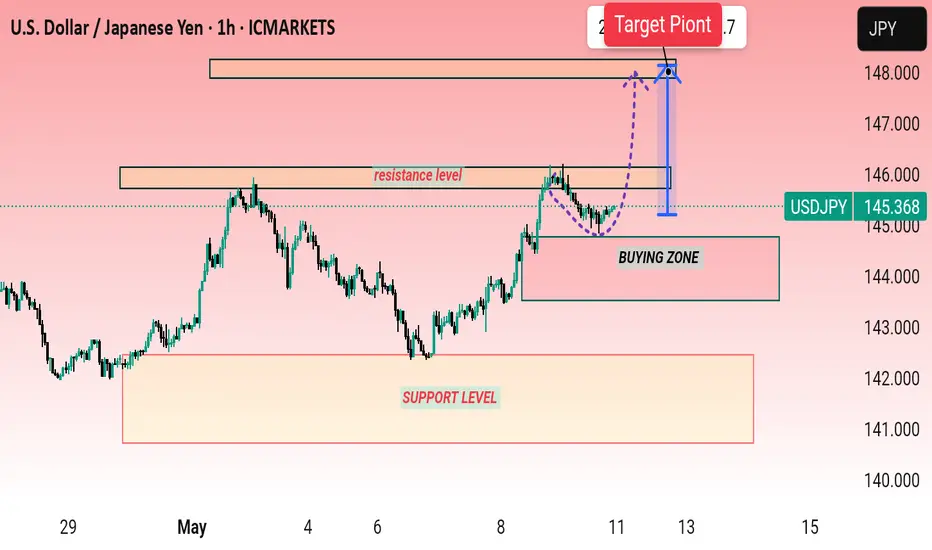
Current Price: 145.368 JPY
Price Movement: Currently experiencing a pullback within an uptrend.
Buying Zone: Highlighted between approximately 144.000 and 145.000. This is where the trader expects buying interest to support the price.
Resistance Level: Around 145.900–146.200, a zone where the price previously struggled to break above.
Target Point: Near 147.700, marked by a red label, showing where the trader anticipates the price could reach if it breaks resistance.
Support Level: Between 140.000 and 143.000, where the price historically found buying interest.
Purple Dashed Line: Indicates the projected path from the buying zone to the target point.
Interpretation:
The chart suggests a bullish setup. If USD/JPY remains above the buying zone and breaks the resistance, the target is set at approximately 147.700. Traders might look to enter near the buying zone and set stop-losses below support.
Would you like help identifying entry, stop-loss, and take-profit levels based on this setup?
Chart Elements and Analysis:
Current Price: 145.368 JPY
Price Movement: Currently experiencing a pullback within an uptrend.
Buying Zone: Highlighted between approximately 144.000 and 145.000. This is where the trader expects buying interest to support the price.
Resistance Level: Around 145.900–146.200, a zone where the price previously struggled to break above.
Target Point: Near 147.700, marked by a red label, showing where the trader anticipates the price could reach if it breaks resistance.
Support Level: Between 140.000 and 143.000, where the price historically found buying interest.
Purple Dashed Line: Indicates the projected path from the buying zone to the target point.
Interpretation:
The chart suggests a bullish setup. If USD/JPY remains above the buying zone and breaks the resistance, the target is set at approximately 147.700. Traders might look to enter near the buying zone and set stop-losses below support.
Would you like help identifying entry, stop-loss, and take-profit levels based on this setup?
Disclaimer
The information and publications are not meant to be, and do not constitute, financial, investment, trading, or other types of advice or recommendations supplied or endorsed by TradingView. Read more in the Terms of Use.
Disclaimer
The information and publications are not meant to be, and do not constitute, financial, investment, trading, or other types of advice or recommendations supplied or endorsed by TradingView. Read more in the Terms of Use.