Hi Traders!
The market is in a Downtrend.
You'll discover the behavior of the market for the daily, H4 and H1 Timeframe.
This is called the Multiple Timeframe Analysis (mtfa).
So let's start with the daily:

At first we drew the most important (turquoise) Levels.
Then we drew the descending and at last the ascending Trendline.
The connection of those trendline results a Triangle.
This Triangle isn't bullish or bearish; it's neutral.
But the bearish pressure is higher, because of:
- You already know the market is in a Downtrend.
- The 50 EMA is resisting and touching the price.
Now we switch to the H4-Timeframe:

Here we analyzed the price action behavior of the Up- and Down-Movements.
As you can see, the Down-Movements are more aggressiv and more straight then the Up-Movements.
Of course it is sometimes the otherway round, but mostly it is like this.
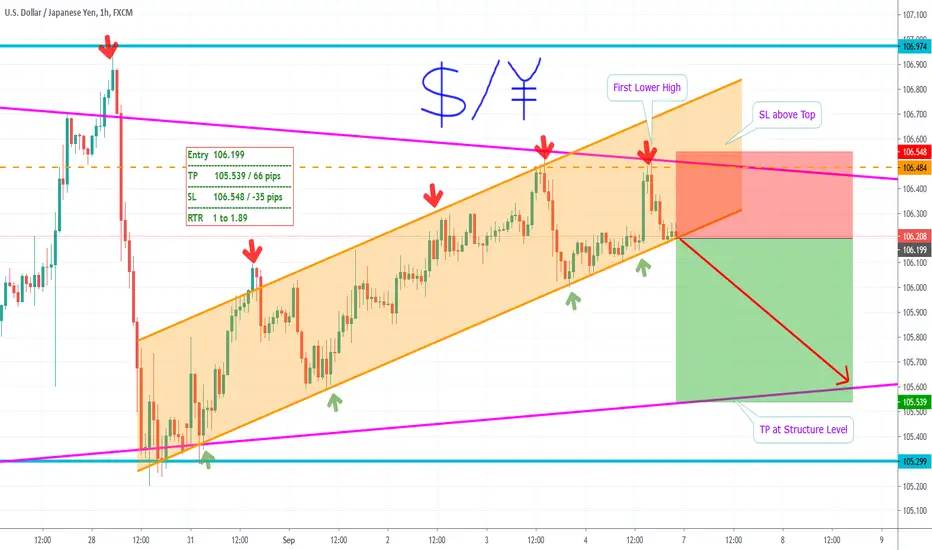
Finally, we get to the H1-Timeframe:

The market is moving in a ascending Parallel Channel.
Pay attention to this:
The most recent high was lower than the High before.
So this was lower high.
In addition the price reached the D1-Trendline.
Our Trading Plan is this:
If the price breaks and closes below the Channel, we short.
The SL is above the recent High, the TP at next conservative Level.
We recommend to trade the market with a Risk-to-Reward ratio (RTR) of at least 1 to 1.5.
Thanks and successful Trading Week :)!
The market is in a Downtrend.
You'll discover the behavior of the market for the daily, H4 and H1 Timeframe.
This is called the Multiple Timeframe Analysis (mtfa).
So let's start with the daily:
At first we drew the most important (turquoise) Levels.
Then we drew the descending and at last the ascending Trendline.
The connection of those trendline results a Triangle.
This Triangle isn't bullish or bearish; it's neutral.
But the bearish pressure is higher, because of:
- You already know the market is in a Downtrend.
- The 50 EMA is resisting and touching the price.
Now we switch to the H4-Timeframe:
Here we analyzed the price action behavior of the Up- and Down-Movements.
As you can see, the Down-Movements are more aggressiv and more straight then the Up-Movements.
Of course it is sometimes the otherway round, but mostly it is like this.
Finally, we get to the H1-Timeframe:
The market is moving in a ascending Parallel Channel.
Pay attention to this:
The most recent high was lower than the High before.
So this was lower high.
In addition the price reached the D1-Trendline.
Our Trading Plan is this:
If the price breaks and closes below the Channel, we short.
The SL is above the recent High, the TP at next conservative Level.
We recommend to trade the market with a Risk-to-Reward ratio (RTR) of at least 1 to 1.5.
Thanks and successful Trading Week :)!
Note
Here is the RED BOX for you:Disclaimer
The information and publications are not meant to be, and do not constitute, financial, investment, trading, or other types of advice or recommendations supplied or endorsed by TradingView. Read more in the Terms of Use.
Disclaimer
The information and publications are not meant to be, and do not constitute, financial, investment, trading, or other types of advice or recommendations supplied or endorsed by TradingView. Read more in the Terms of Use.