Hello traders! 👋
We've just spotted a classic Bullish Flag breakout on USDJPY (30m chart) — one of the cleanest continuation patterns in price action trading.
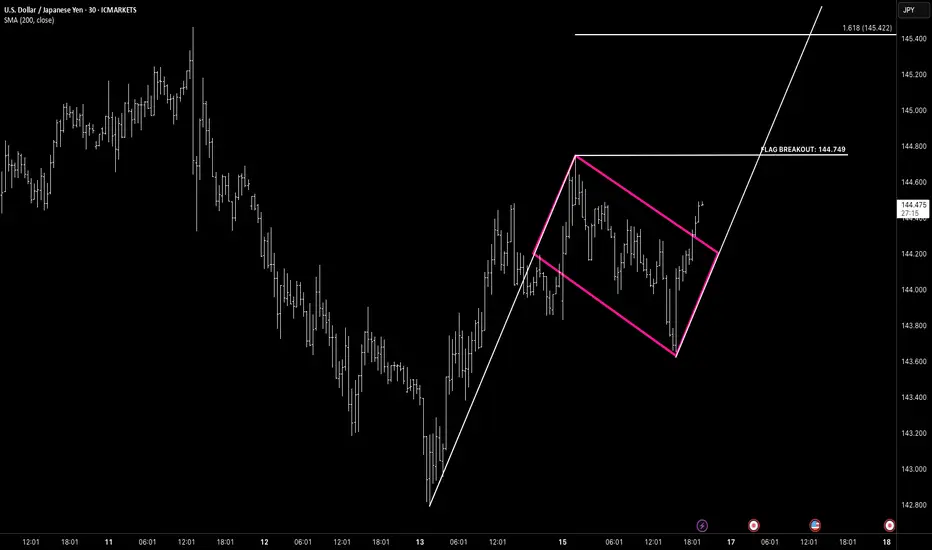
After a strong impulse leg to the upside, price formed a downward-sloping flag — a textbook consolidation pattern. The breakout above 144.749 confirms buyer control and sets the stage for continuation toward 145.42, the 1.618 Fibonacci extension.
📌 Pattern: Bullish Flag
📌 Breakout Level: 144.749
📌 Target: 145.42
📌 Stop: Below 143.60 (flag low / invalidation zone)
🧠 Structure Note:
The symmetry of the flag is clean, with measured move projection aligning with the extension target. This setup shows clear impulsive energy, consolidation, and breakout — ideal continuation behavior.
🎯 Trading Plan:
If price holds above 144.75, we’re looking at a move toward 145.00 first, with extended continuation to 145.42. If price fails and drops back below the flag, the setup is invalidated — as always, risk management first.
Let the structure guide you, not your emotions. Stay disciplined.
—
📈 Trade Chart Patterns Like The Pros
We've just spotted a classic Bullish Flag breakout on USDJPY (30m chart) — one of the cleanest continuation patterns in price action trading.
After a strong impulse leg to the upside, price formed a downward-sloping flag — a textbook consolidation pattern. The breakout above 144.749 confirms buyer control and sets the stage for continuation toward 145.42, the 1.618 Fibonacci extension.
📌 Pattern: Bullish Flag
📌 Breakout Level: 144.749
📌 Target: 145.42
📌 Stop: Below 143.60 (flag low / invalidation zone)
🧠 Structure Note:
The symmetry of the flag is clean, with measured move projection aligning with the extension target. This setup shows clear impulsive energy, consolidation, and breakout — ideal continuation behavior.
🎯 Trading Plan:
If price holds above 144.75, we’re looking at a move toward 145.00 first, with extended continuation to 145.42. If price fails and drops back below the flag, the setup is invalidated — as always, risk management first.
Let the structure guide you, not your emotions. Stay disciplined.
—
📈 Trade Chart Patterns Like The Pros
Disclaimer
The information and publications are not meant to be, and do not constitute, financial, investment, trading, or other types of advice or recommendations supplied or endorsed by TradingView. Read more in the Terms of Use.
Disclaimer
The information and publications are not meant to be, and do not constitute, financial, investment, trading, or other types of advice or recommendations supplied or endorsed by TradingView. Read more in the Terms of Use.