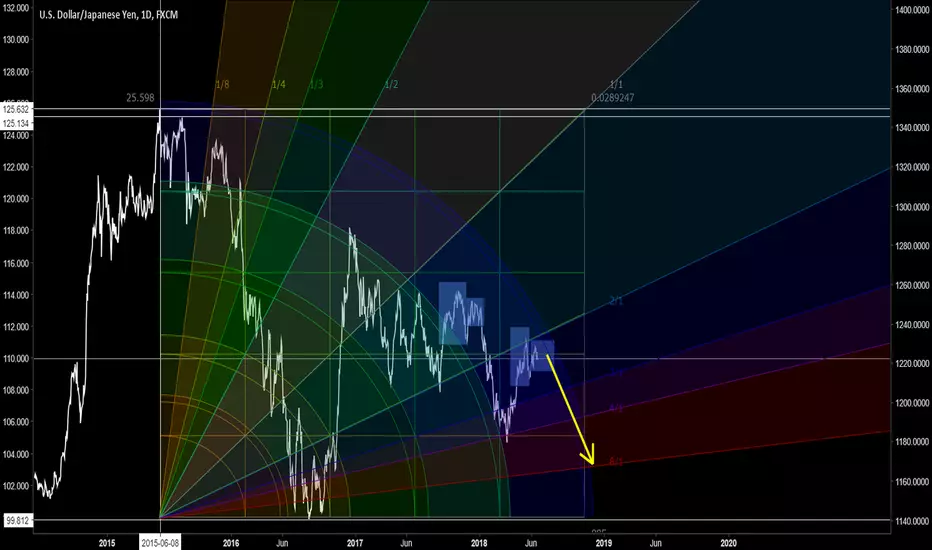
USDJPY is about to start a downride on daily as you see. It reached the fib arc and repeats the bearish reversal patterns from the past waves. Follow the price to complete that bearish pattern it copies from the past and once it hits the fibonacci arc, we go for a down slide. Then watch for reactions or pullbacks at Gann angles. Every Gann angle line acts as support which price has to break. We can also do Elliot wave wave count once price starts moving downwards. We take TP once Elliot wave 5 is completed! It agrees with our geometrical arc analysis on XAUUSD which is about to start a ride up. Gold and USDJPY 0.02% have negative correlation (-65.5 percent on daily), as you know. You can also short Nikkei (JPN225) as they have +78 % positive correlation. If one thing goes up the other down. Our analysis confirm this correlation.
Disclaimer
The information and publications are not meant to be, and do not constitute, financial, investment, trading, or other types of advice or recommendations supplied or endorsed by TradingView. Read more in the Terms of Use.
Disclaimer
The information and publications are not meant to be, and do not constitute, financial, investment, trading, or other types of advice or recommendations supplied or endorsed by TradingView. Read more in the Terms of Use.