USDJPY made an attempt to breakout from symmetrical triangle pattern on 12/6/2024 before US CPI Data released.
After US CPI Data released on 12/6/2024, the USDJPY dropped tremendously from 157.37 to 155.75 level.
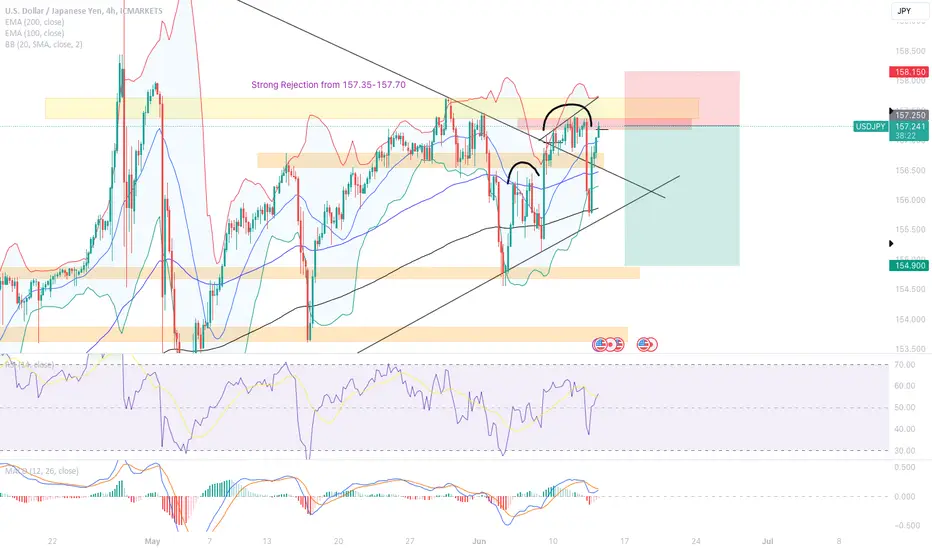
Today 13/6/2024, USDJPY climbed to sensitive rejection level 157.35 again.
On 4-Hours Timeframe Chart, you can see a potential Head & Shoulder Formation.
The USDJPY Price is currently forming a possible right shoulder, which potential peak will be at between 157.30 to 157.40 area.
If a Solid Bear candlestick formed break the support of 156.90 Level, you will see a waterfall happening to 154.90 level.
My Entry Price: 157.26
Profit Target: 154.90
Stop Loss: 158.15
Risk : Reward: 1 : 2.61
After US CPI Data released on 12/6/2024, the USDJPY dropped tremendously from 157.37 to 155.75 level.
Today 13/6/2024, USDJPY climbed to sensitive rejection level 157.35 again.
On 4-Hours Timeframe Chart, you can see a potential Head & Shoulder Formation.
The USDJPY Price is currently forming a possible right shoulder, which potential peak will be at between 157.30 to 157.40 area.
If a Solid Bear candlestick formed break the support of 156.90 Level, you will see a waterfall happening to 154.90 level.
My Entry Price: 157.26
Profit Target: 154.90
Stop Loss: 158.15
Risk : Reward: 1 : 2.61
Disclaimer
The information and publications are not meant to be, and do not constitute, financial, investment, trading, or other types of advice or recommendations supplied or endorsed by TradingView. Read more in the Terms of Use.
Disclaimer
The information and publications are not meant to be, and do not constitute, financial, investment, trading, or other types of advice or recommendations supplied or endorsed by TradingView. Read more in the Terms of Use.