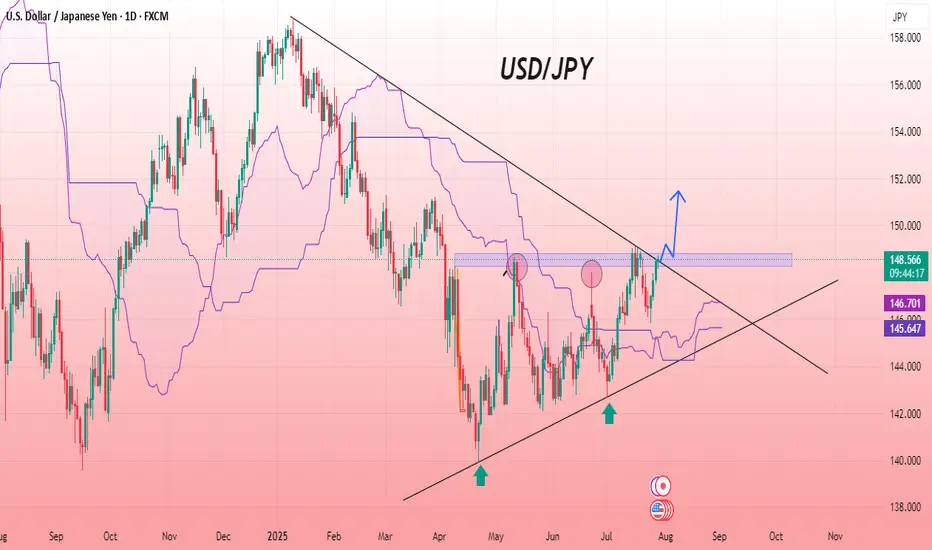
The USDJPY chart shows a clear bullish breakout from a long-term descending trendline, signaling a potential shift in momentum. The pair has formed higher lows, marked by multiple rejections near the ascending support trendline, confirming strong buying interest. Price has successfully broken through a key resistance zone, turning it into support, with Ichimoku cloud indicators supporting the upward movement. A bullish continuation is expected as the price maintains strength above the breakout zone. The recent breakout candle and upward arrow suggest bullish sentiment and room for further upside, aligning with the overall trend reversal pattern visible on the chart.
Entry Buy: 148.570
Target point: 151.500
If you found this analysis helpful, don’t forget to drop a like and comment . Your support keeps quality ideas flowing—let’s grow and win together! 💪📈
Entry Buy: 148.570
Target point: 151.500
If you found this analysis helpful, don’t forget to drop a like and comment . Your support keeps quality ideas flowing—let’s grow and win together! 💪📈
Trade active
Trade active in buy Join telegram channel free ..
t.me/GoldMan0009
Forex, Gold & Crypto Signals with detailed analysis & get consistent results..
Gold Signal's with proper TP & SL for high profit opportunities..
t.me/GoldMan0009
t.me/GoldMan0009
Forex, Gold & Crypto Signals with detailed analysis & get consistent results..
Gold Signal's with proper TP & SL for high profit opportunities..
t.me/GoldMan0009
Disclaimer
The information and publications are not meant to be, and do not constitute, financial, investment, trading, or other types of advice or recommendations supplied or endorsed by TradingView. Read more in the Terms of Use.
Join telegram channel free ..
t.me/GoldMan0009
Forex, Gold & Crypto Signals with detailed analysis & get consistent results..
Gold Signal's with proper TP & SL for high profit opportunities..
t.me/GoldMan0009
t.me/GoldMan0009
Forex, Gold & Crypto Signals with detailed analysis & get consistent results..
Gold Signal's with proper TP & SL for high profit opportunities..
t.me/GoldMan0009
Disclaimer
The information and publications are not meant to be, and do not constitute, financial, investment, trading, or other types of advice or recommendations supplied or endorsed by TradingView. Read more in the Terms of Use.