USD/JPY Technical Analysis – 1H Chart
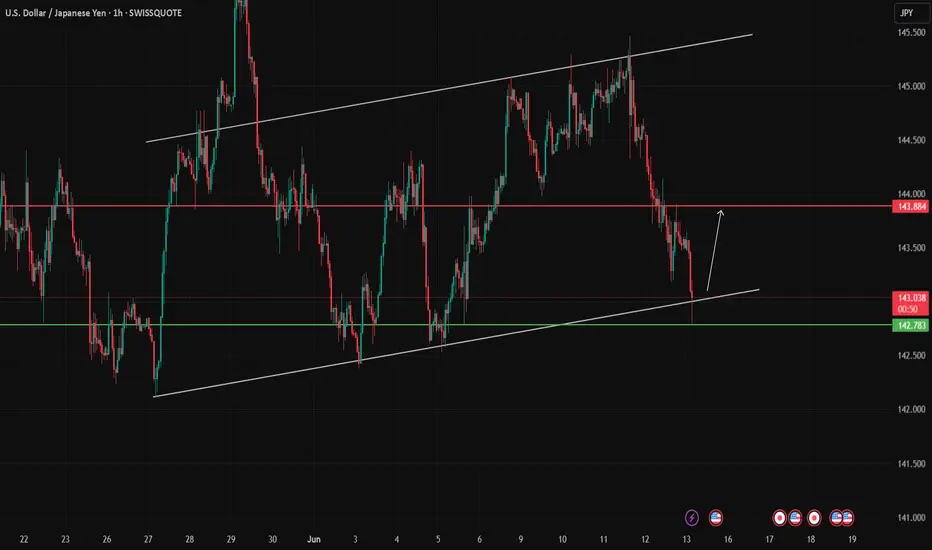
Price is currently testing a key confluence support zone formed by the ascending channel's lower boundary and the horizontal level at 142.78. A bullish rejection candle suggests a potential rebound toward the 143.88 resistance level. If this level breaks, further upside toward the upper channel boundary is likely. However, a confirmed break below 142.78 could signal bearish continuation. Monitor price action closely for confirmation.
Price is currently testing a key confluence support zone formed by the ascending channel's lower boundary and the horizontal level at 142.78. A bullish rejection candle suggests a potential rebound toward the 143.88 resistance level. If this level breaks, further upside toward the upper channel boundary is likely. However, a confirmed break below 142.78 could signal bearish continuation. Monitor price action closely for confirmation.
Disclaimer
The information and publications are not meant to be, and do not constitute, financial, investment, trading, or other types of advice or recommendations supplied or endorsed by TradingView. Read more in the Terms of Use.
Disclaimer
The information and publications are not meant to be, and do not constitute, financial, investment, trading, or other types of advice or recommendations supplied or endorsed by TradingView. Read more in the Terms of Use.