🕛 TOPDOWN - Navigating Breakouts and Corrections
Overview: This currency pair broke a 25-year resistance level last year, displaying a fakeout. This year, a robust flow confirms the breakout, with potential for a yearly closing above this level. There's also proximity to breaking a multi-year head and shoulders pattern, accompanied by substantial multi-year buy volume. On the monthly chart, a cup and handle formation is observed, potentially forming a twizzer top for a last pullback. The weekly chart indicates a pre-breakout buildup, with the last week's liquidity sweep candle hinting at further upward movement, especially given its location above the yearly CIP levels.
😇 7 Dimension Analysis
Time Frame: Daily
1️⃣ Swing Structure: Bullish
🟢 Structure Behavior/BoS: Break of Structure
🟢 Swing Move: Corrective, but a classic bullish pinbar signals the end of correction and a valid high. The upcoming FVG area may guide the final decision based on potential rejection.
🟢 Inducement: Done; the next unmitigated order block is crucial if prices decline further.
🟢 1st Pullback: Possibly deep; internal structure is bearish corrective. Noteworthy is the liquidity sweep indicating potential fakeouts or continuations on the buy side.
🟢 Resistance/Support Areas: Resistance, supply, and trendline broken, yet resistance is yet to be broken. Buildup and pre-breakout QC suggest cautious optimism.
2️⃣ Pattern
🟢 CHART PATTERNS
Reversal
Rounding Patterns, Double Top.
Consolidation
Rectangle signaling a bearish breakout.
Raising Wedge with bearish breakout.
Shakeout Continuation, favorable for bulls.
🟢 CANDLE PATTERNS
Key Observations:
Long wicks: Hammer at yearly CIP.
Momentum candles: Engulfing/Fakeout/FOMO favor bulls.
Inside: Narrow Range 4, anticipating breakout direction.
Tower top/bottom signals climax players favoring bullish FOMO.
3️⃣ Volume: Average volume observed, necessitating observation during corrections and cycles.
4️⃣ Momentum RSI:
🟢 Momentum State: Sideways yet.
🟢 Range Shift: From super bullish to sideways.
🟢 Divergence: Back-to-back bearish divergence suggests a potential correction.
🟢 Grandfather-Father-Son Entries: Strongest buy area post-correction.
5️⃣ Volatility Bollinger Bands:
🟢 Middle Band Trend: Bullish; crossing for buy signals.
🟢 Headfake: Lower line head fake signifies a strong buy signal.
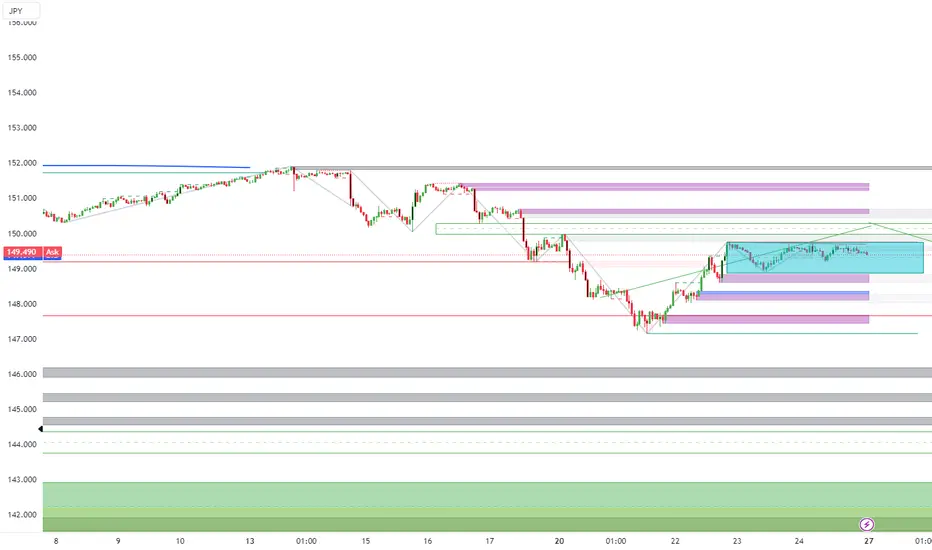
6️⃣ Strength - ROC Values: JPY is the weakest against all currencies currently.
✔️ Entry Time Frame: Two areas for buy consideration - Daily (144.555) and Hourly (149.49).
✅ Entry TF Structure:
☑️ Current Move:
✔ Support/Resistance Base:
☑️ Candles Behavior: RSC, Longwicks, Doji, Inside, Momentum.
☑️ FIB Trigger Event
☑️ Trend Line Breakout
☑️ Final Comments:
💡 Decision:
🚀 Entry:
✋ Stop Loss:
🎯 Take Profit: 2nd Exit if Internal Structure Changes, 3rd Trendline Breakout, FOMO.
😊 Risk to Reward Ratio:
🕛 Expected Duration:
SUMMARY: The analysis showcases a bullish scenario with a breakout from a significant resistance level. While corrections are anticipated, the structure remains bullish, with potential buy entries on both daily and hourly time frames. Divergence signals caution, and key candle patterns, volume analysis, and strength indicators contribute to a comprehensive strategy for navigating this intricate market situation.
I will update this idea further with coming market condition and also update all tp and stop level
Overview: This currency pair broke a 25-year resistance level last year, displaying a fakeout. This year, a robust flow confirms the breakout, with potential for a yearly closing above this level. There's also proximity to breaking a multi-year head and shoulders pattern, accompanied by substantial multi-year buy volume. On the monthly chart, a cup and handle formation is observed, potentially forming a twizzer top for a last pullback. The weekly chart indicates a pre-breakout buildup, with the last week's liquidity sweep candle hinting at further upward movement, especially given its location above the yearly CIP levels.
😇 7 Dimension Analysis
Time Frame: Daily
1️⃣ Swing Structure: Bullish
🟢 Structure Behavior/BoS: Break of Structure
🟢 Swing Move: Corrective, but a classic bullish pinbar signals the end of correction and a valid high. The upcoming FVG area may guide the final decision based on potential rejection.
🟢 Inducement: Done; the next unmitigated order block is crucial if prices decline further.
🟢 1st Pullback: Possibly deep; internal structure is bearish corrective. Noteworthy is the liquidity sweep indicating potential fakeouts or continuations on the buy side.
🟢 Resistance/Support Areas: Resistance, supply, and trendline broken, yet resistance is yet to be broken. Buildup and pre-breakout QC suggest cautious optimism.
2️⃣ Pattern
🟢 CHART PATTERNS
Reversal
Rounding Patterns, Double Top.
Consolidation
Rectangle signaling a bearish breakout.
Raising Wedge with bearish breakout.
Shakeout Continuation, favorable for bulls.
🟢 CANDLE PATTERNS
Key Observations:
Long wicks: Hammer at yearly CIP.
Momentum candles: Engulfing/Fakeout/FOMO favor bulls.
Inside: Narrow Range 4, anticipating breakout direction.
Tower top/bottom signals climax players favoring bullish FOMO.
3️⃣ Volume: Average volume observed, necessitating observation during corrections and cycles.
4️⃣ Momentum RSI:
🟢 Momentum State: Sideways yet.
🟢 Range Shift: From super bullish to sideways.
🟢 Divergence: Back-to-back bearish divergence suggests a potential correction.
🟢 Grandfather-Father-Son Entries: Strongest buy area post-correction.
5️⃣ Volatility Bollinger Bands:
🟢 Middle Band Trend: Bullish; crossing for buy signals.
🟢 Headfake: Lower line head fake signifies a strong buy signal.
6️⃣ Strength - ROC Values: JPY is the weakest against all currencies currently.
✔️ Entry Time Frame: Two areas for buy consideration - Daily (144.555) and Hourly (149.49).
✅ Entry TF Structure:
☑️ Current Move:
✔ Support/Resistance Base:
☑️ Candles Behavior: RSC, Longwicks, Doji, Inside, Momentum.
☑️ FIB Trigger Event
☑️ Trend Line Breakout
☑️ Final Comments:
💡 Decision:
🚀 Entry:
✋ Stop Loss:
🎯 Take Profit: 2nd Exit if Internal Structure Changes, 3rd Trendline Breakout, FOMO.
😊 Risk to Reward Ratio:
🕛 Expected Duration:
SUMMARY: The analysis showcases a bullish scenario with a breakout from a significant resistance level. While corrections are anticipated, the structure remains bullish, with potential buy entries on both daily and hourly time frames. Divergence signals caution, and key candle patterns, volume analysis, and strength indicators contribute to a comprehensive strategy for navigating this intricate market situation.
I will update this idea further with coming market condition and also update all tp and stop level
Disclaimer
The information and publications are not meant to be, and do not constitute, financial, investment, trading, or other types of advice or recommendations supplied or endorsed by TradingView. Read more in the Terms of Use.
Disclaimer
The information and publications are not meant to be, and do not constitute, financial, investment, trading, or other types of advice or recommendations supplied or endorsed by TradingView. Read more in the Terms of Use.