1. Previous Uptrend Channel
📈
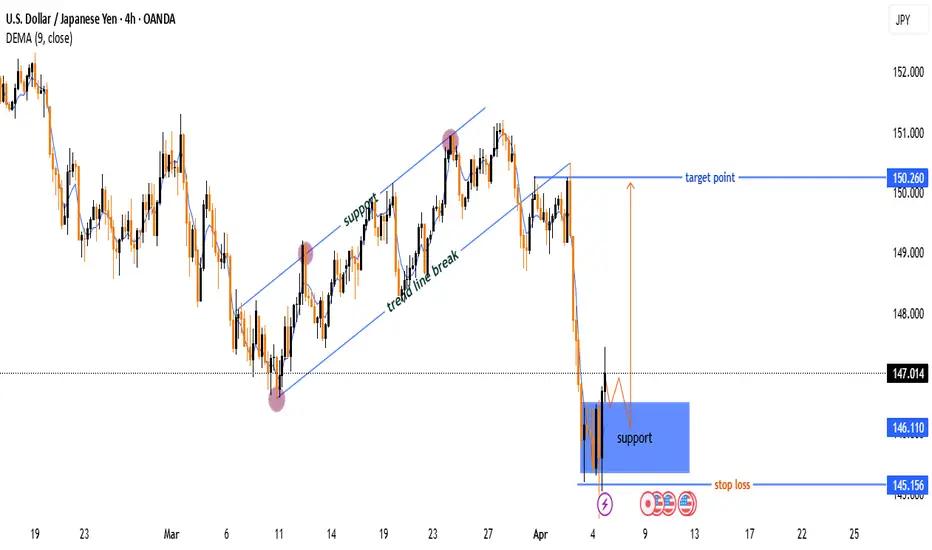
Price moved in a rising channel
Lower trendline acted as support ✅
Then came the trend line break ⚠️ — signal of trend reversal
2. Major Drop
🔻💥
After breaking support, the price fell sharply
Strong bearish momentum took over
Sellers dominated the market
3. Support Zone Identified
🟦 Support Box (146.110 - 145.156)
Buyers stepped in at this level
Possible bounce or consolidation
Price currently at 147.014 — just above support
4. Trade Setup Idea
🛒 Buy Opportunity (if price holds support)
📌 Entry Zone: Around 146.110
🎯 Target: 150.260
🛑 Stop Loss: 145.156
📊 Risk:Reward = ~1:2 — solid R:R setup!
5. Indicators & Confirmations
🟠 DEMA (9): Sitting at 146.110 — aligns with support!
✅ Extra confluence for the bounce!
Summary
If price holds above support:
Buyers might push toward 150.260
If it breaks below 145.156:
Sellers may regain control
📈
Price moved in a rising channel
Lower trendline acted as support ✅
Then came the trend line break ⚠️ — signal of trend reversal
2. Major Drop
🔻💥
After breaking support, the price fell sharply
Strong bearish momentum took over
Sellers dominated the market
3. Support Zone Identified
🟦 Support Box (146.110 - 145.156)
Buyers stepped in at this level
Possible bounce or consolidation
Price currently at 147.014 — just above support
4. Trade Setup Idea
🛒 Buy Opportunity (if price holds support)
📌 Entry Zone: Around 146.110
🎯 Target: 150.260
🛑 Stop Loss: 145.156
📊 Risk:Reward = ~1:2 — solid R:R setup!
5. Indicators & Confirmations
🟠 DEMA (9): Sitting at 146.110 — aligns with support!
✅ Extra confluence for the bounce!
Summary
If price holds above support:
Buyers might push toward 150.260
If it breaks below 145.156:
Sellers may regain control
join my tellegram channel
t.me/JaMesGoldFiGhteR786
join my refferal broker
one.exnesstrack.org/a/g565sj1uo7?source=app
t.me/JaMesGoldFiGhteR786
join my refferal broker
one.exnesstrack.org/a/g565sj1uo7?source=app
Disclaimer
The information and publications are not meant to be, and do not constitute, financial, investment, trading, or other types of advice or recommendations supplied or endorsed by TradingView. Read more in the Terms of Use.