Chart Overview
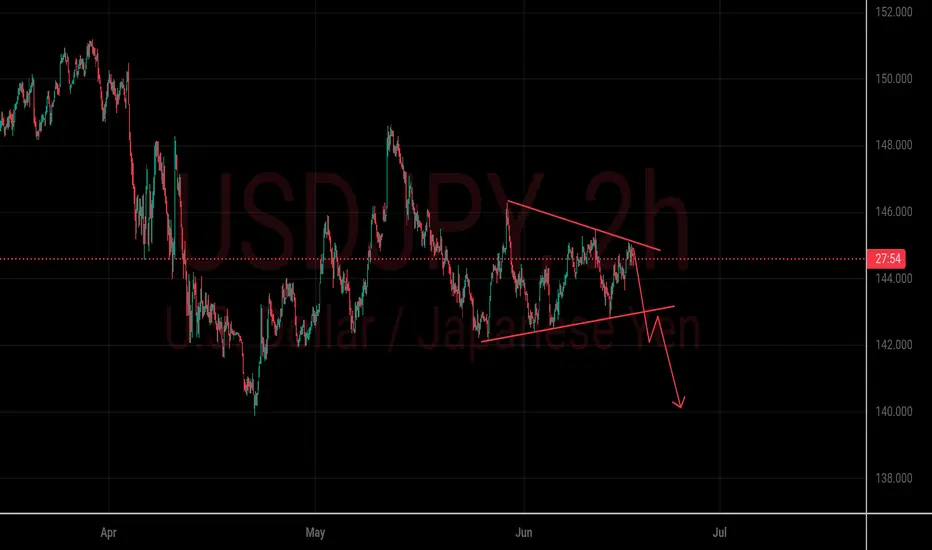
The USDJPY pair on the 2-hour chart is currently forming a descending triangle pattern — a typical bearish continuation setup.
---
Key Observations:
Resistance Line (Upper Trendline): Price is repeatedly rejected from lower highs.
Support Line (Lower Horizontal): Price maintains support around the 144.00–144.20 region.
Bearish Bias: The red arrow projection suggests a breakdown from the triangle, with a potential move toward 140.00 if the lower support fails.
---
Potential Bearish Scenario:
1. Break below ~144.00 confirms the triangle breakdown.
2. First target around 142.00, second target near 140.00.
3. Stop-loss ideally above 145.00 if entering short.
---
Disclaimer:
This analysis is for educational purposes and not financial advice. Always perform your own due diligence or consult a financial advisor before making trading decisions.
Related publications
Disclaimer
The information and publications are not meant to be, and do not constitute, financial, investment, trading, or other types of advice or recommendations supplied or endorsed by TradingView. Read more in the Terms of Use.
Related publications
Disclaimer
The information and publications are not meant to be, and do not constitute, financial, investment, trading, or other types of advice or recommendations supplied or endorsed by TradingView. Read more in the Terms of Use.