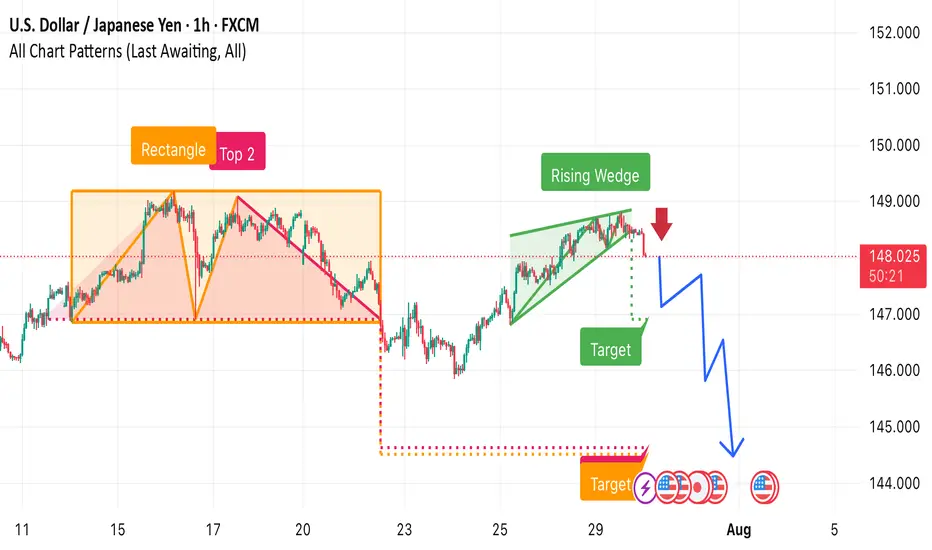
1. Rectangle + Double Top (“Top 2”) Formation (left side):
• Price ranged between ~147.5 and ~149.5.
• A double top inside the rectangle signaled resistance and potential reversal.
• Breakdown from the rectangle zone occurred, confirming bearish momentum.
2. Rising Wedge Pattern (right side, green zone):
• A bearish pattern forming higher highs and higher lows.
• The red arrow indicates an expected breakdown from the wedge.
3. Bearish Price Projection (blue arrows):
• The chart projects a sharp drop following the wedge breakdown.
• Multiple target levels are marked:
• First Target: ~147.0 zone.
• Final Target: Near 144.0, aligning with the measured move from previous breakdown.
4. Confluence of Bearish Signals:
• Rectangle breakdown + rising wedge.
• Bearish candle rejection near 149 resistance.
• Pattern-based technical targets drawn using past behavior.
𝙇𝙚𝙩'𝙨 𝙎𝙩𝙖𝙧𝙩 𝙔𝙤𝙪𝙧 𝙟𝙤𝙪𝙧𝙣𝙚𝙮 𝙒𝙞𝙩𝙝 𝙎𝙖𝙛𝙚 𝙏𝙧𝙖𝙙𝙞𝙣𝙜 𝙈𝙖𝙨𝙩𝙚𝙧 𝙡𝙚𝙫𝙚𝙡 𝙏𝙧𝙖𝙙𝙞𝙣g
Disclaimer
The information and publications are not meant to be, and do not constitute, financial, investment, trading, or other types of advice or recommendations supplied or endorsed by TradingView. Read more in the Terms of Use.
𝙇𝙚𝙩'𝙨 𝙎𝙩𝙖𝙧𝙩 𝙔𝙤𝙪𝙧 𝙟𝙤𝙪𝙧𝙣𝙚𝙮 𝙒𝙞𝙩𝙝 𝙎𝙖𝙛𝙚 𝙏𝙧𝙖𝙙𝙞𝙣𝙜 𝙈𝙖𝙨𝙩𝙚𝙧 𝙡𝙚𝙫𝙚𝙡 𝙏𝙧𝙖𝙙𝙞𝙣g
Disclaimer
The information and publications are not meant to be, and do not constitute, financial, investment, trading, or other types of advice or recommendations supplied or endorsed by TradingView. Read more in the Terms of Use.