USDJPY - Complete technical analysis - Breakout, mtfa and more!
Hi Traders!
The market is moving in an overall Downtrend.
Let's begin the multiple timeframes analysis with the Weekly Timeframe.
Ready?
Here is it:

We'll ask you a question before:
What is the most obvious structure level which catches the most attention?
The most of you propably answer that it is the "Important Support Area" (it's false in the screenshort, :( sorry for that).
Ok, so let's have a closer look on what's going on there.
Let's imagine, the chart is only tracking the route you're walking.
Think of a person you hate.
If you see this person, you'll propably take a big detour to avoid it.
You do this once, twice, three times...
Than you take a shorter detour.
And even shorter.
Now you stop and you're even talking to that person.
Do you think, you still hate this person? Of course not!
It's the same for the price and the Resistance.
It was making big Pullbacks which became shorter and shorter.
Now price is even holding on Resistance.
What could that mean?
The bearish pressure is at the moment very high and the Trendline supports this situation additionally.
Because of the weakness of the Buyers, the market is now preparing for a Breakout.
The Bearish Trend will continue on then.
This is the main thoughts of the idea.
We have to shorten this up, so here is the Daily Timeframe:

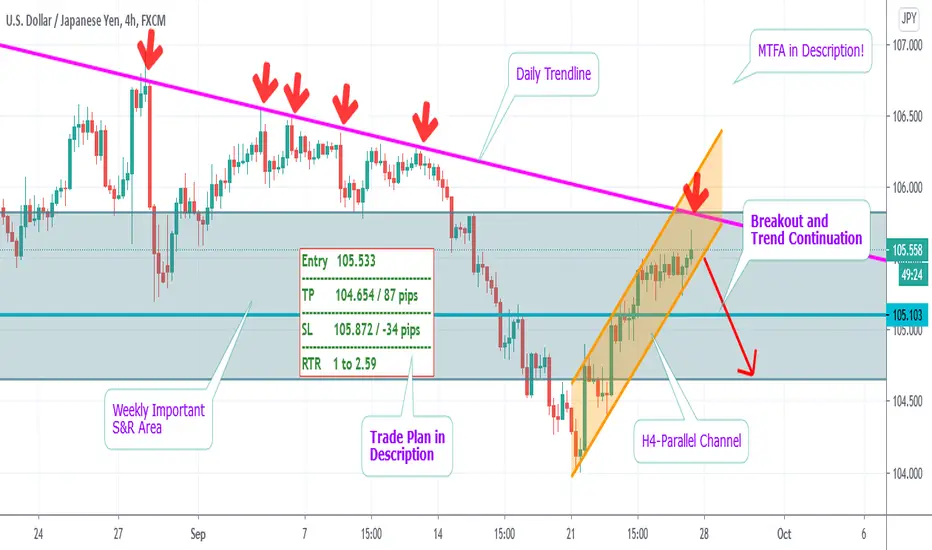
The main thing here is the strong descending Trendline.
It brings some more bearish pressure into the market.
The main idea here is to sell at the Pullback of the Trendline.
H4-Timeframe (Thumbnail):

Here you can see the market is moving in the parallel channel.
It is just some pips before the Trendline.
The main idea here is to trade the Breakout of the Parallel Channel.
Finally, here is the Entry Timeframe H1:

As you can see the SL is above the high.
The TP is very conservative and at the bottom of the area.
The Risk-to-reward ratio is above 1 to 2.5.
We recommend to trade the Breakout with a Retest.
Thanks and successful Trading :)!
The market is moving in an overall Downtrend.
Let's begin the multiple timeframes analysis with the Weekly Timeframe.
Ready?
Here is it:
We'll ask you a question before:
What is the most obvious structure level which catches the most attention?
The most of you propably answer that it is the "Important Support Area" (it's false in the screenshort, :( sorry for that).
Ok, so let's have a closer look on what's going on there.
Let's imagine, the chart is only tracking the route you're walking.
Think of a person you hate.
If you see this person, you'll propably take a big detour to avoid it.
You do this once, twice, three times...
Than you take a shorter detour.
And even shorter.
Now you stop and you're even talking to that person.
Do you think, you still hate this person? Of course not!
It's the same for the price and the Resistance.
It was making big Pullbacks which became shorter and shorter.
Now price is even holding on Resistance.
What could that mean?
The bearish pressure is at the moment very high and the Trendline supports this situation additionally.
Because of the weakness of the Buyers, the market is now preparing for a Breakout.
The Bearish Trend will continue on then.
This is the main thoughts of the idea.
We have to shorten this up, so here is the Daily Timeframe:
The main thing here is the strong descending Trendline.
It brings some more bearish pressure into the market.
The main idea here is to sell at the Pullback of the Trendline.
H4-Timeframe (Thumbnail):
Here you can see the market is moving in the parallel channel.
It is just some pips before the Trendline.
The main idea here is to trade the Breakout of the Parallel Channel.
Finally, here is the Entry Timeframe H1:
As you can see the SL is above the high.
The TP is very conservative and at the bottom of the area.
The Risk-to-reward ratio is above 1 to 2.5.
We recommend to trade the Breakout with a Retest.
Thanks and successful Trading :)!
Note
Here is the RED BOX for you, in case you need it ;)Disclaimer
The information and publications are not meant to be, and do not constitute, financial, investment, trading, or other types of advice or recommendations supplied or endorsed by TradingView. Read more in the Terms of Use.
Disclaimer
The information and publications are not meant to be, and do not constitute, financial, investment, trading, or other types of advice or recommendations supplied or endorsed by TradingView. Read more in the Terms of Use.