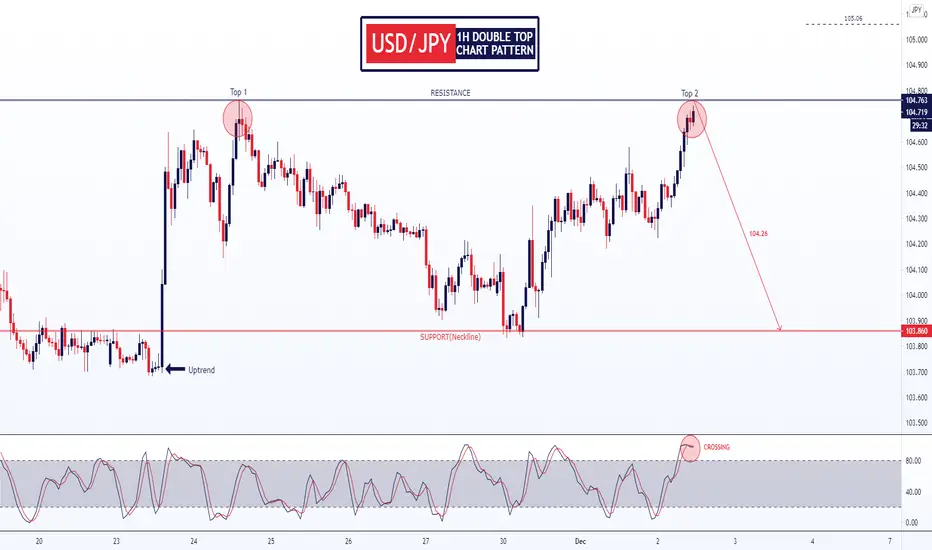
It's an hourly chart of USD/JPY. The USD/JPY is trying to make a structure of the double top pattern. But rightnow, we can't call it a double top pattern. If it crosses the neckline then, it will become a double top pattern. To touch the neckline, it has to cross 104.26. I have applied the indicator (RSI), which indicates a fall.
But what if it continues to grow?
If it does not stop to grow, then it will touch 105.06.
But what if it continues to grow?
If it does not stop to grow, then it will touch 105.06.
Trade closed: target reached
Disclaimer
The information and publications are not meant to be, and do not constitute, financial, investment, trading, or other types of advice or recommendations supplied or endorsed by TradingView. Read more in the Terms of Use.
Disclaimer
The information and publications are not meant to be, and do not constitute, financial, investment, trading, or other types of advice or recommendations supplied or endorsed by TradingView. Read more in the Terms of Use.