Happy new week traders!
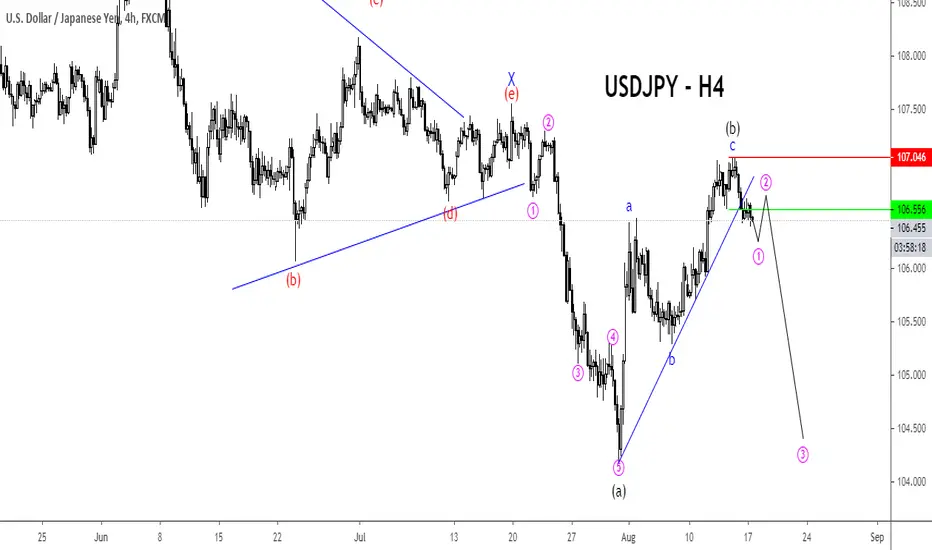
In the USDJPY 4 hourly chart above, price broke out of a triangle pattern and made a five-wave impulse decline in wave (a).
A three-wave corrective move that unfolded has a zigzag pattern follows the sell-off in wave (b).
According to Elliot Wave theory, once a 5-3 wave cycle is completed, the price resumes in the direction of the impulse wave.
In USDJPY case, if this count is correct we should see a massive decline that will take the low of wave (a) in the days ahead.
- Invalidation level is the red line on the chart
- Entry is the green line which has been triggered
Alternative Count: 1-2, (I)-(ii).
Good luck on the chart!
Veejahbee
Disclaimer
The information and publications are not meant to be, and do not constitute, financial, investment, trading, or other types of advice or recommendations supplied or endorsed by TradingView. Read more in the Terms of Use.
Disclaimer
The information and publications are not meant to be, and do not constitute, financial, investment, trading, or other types of advice or recommendations supplied or endorsed by TradingView. Read more in the Terms of Use.