"Momentum Building Above Retested Demand – Will Bulls Take Control?"
📊 Market Structure Overview:
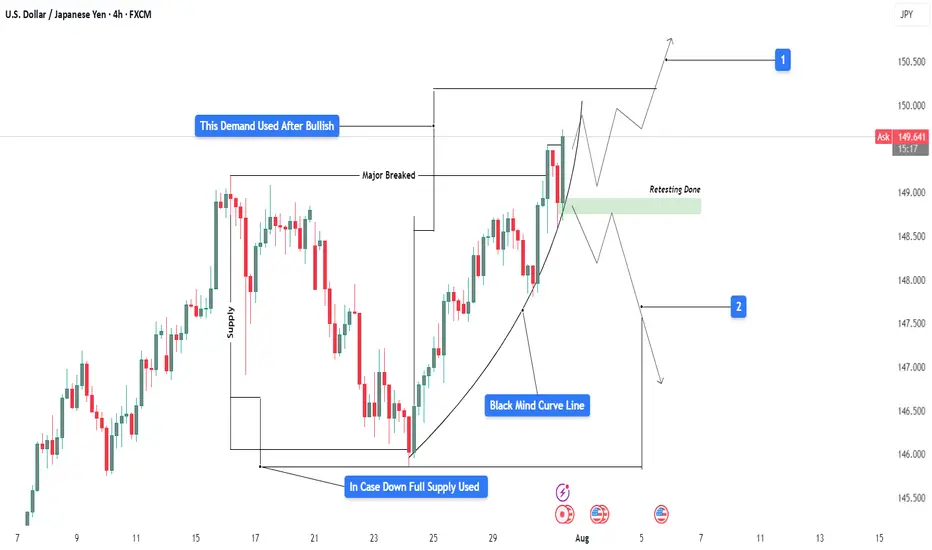
USDJPY has shown a clean bullish structure in recent sessions, supported by a strong demand retest and a steady parabolic curve formation (Black Mind Curve Line). The pair has successfully broken above a major resistance, retested it, and is now holding higher ground—suggesting potential for continued upside if current structure holds.
🧱 Detailed Technical Breakdown:
🔹 1. Demand & Retesting Behavior
The chart highlights a key demand zone (green box) that was previously used after a bullish move.
Price recently returned to this zone for a clean retest, validating its role as a strong support.
This type of retesting behavior is critical in smart money analysis, confirming that accumulation has occurred and sellers have been absorbed.
🔹 2. Major Breakout Confirmation
The previous major structure level has been decisively broken to the upside.
This level now acts as support, increasing the probability that the bullish move will sustain.
🔹 3. Black Mind Curve Line (Parabolic Structure)
A parabolic curved trendline supports the current price action, showing how bulls are gradually gaining momentum.
This curve represents buyer interest increasing over time, which often leads to an aggressive breakout when paired with retest confirmation.
📍 Key Price Zones:
Type Price Level (Approx.) Description
🔹 Retesting Zone ~148.800 – 149.100 Support zone after major breakout
🔺 Resistance Target (1) ~150.500 Bullish breakout target (short-term)
🔻 Downside Risk (2) ~147.000 – 146.500 Bearish invalidation zone if demand fails
🔹 Full Supply Area ~145.000 – 145.500 Historical supply zone if price fails completely
🔮 Trade Scenarios:
✅ Scenario 1 – Bullish Continuation (Primary Bias)
Retest is complete, and price is holding above the curve and demand zone.
If bullish momentum continues:
📈 Target 1: 150.50 – Near-term resistance and liquidity area
📈 Target 2: 151.20+ – Extension target if buyers dominate
Bullish Confirmation:
Price must stay above ~149.00 and continue forming higher highs.
Entry ideas: Wait for minor consolidation above current price or bullish breakout from mini range.
⚠️ Scenario 2 – Bearish Rejection
If price rejects from current level and breaks below the curve and demand zone (~148.80):
📉 First downside target: 147.00 (minor support)
📉 Final bearish target: 145.50 (full supply zone)
Bearish Confirmation:
Breakdown of curve support and close below the retesting zone with momentum.
Such a move would suggest buyers failed, and market may rotate lower.
🧠 Market Sentiment & Psychology:
Smart Money Behavior: Demand was filled cleanly and retested, indicating possible institutional interest at that level.
Momentum Curve: As shown by the black curve, momentum is rising gradually—this reflects confidence building among buyers.
However, price is near psychological resistance (150.00–150.50 zone), where heavy sell orders might be placed.
The market is in a decision zone, where confirmation of strength or failure will dictate the next 200–300 pip move.
🎯 Summary:
USDJPY is showing a bullish structure supported by:
A valid retest of demand
A clean breakout of major resistance
An ascending parabolic curve
If bulls defend the current zone, we may see a powerful continuation toward 150.50+. If price fails to hold above the retest zone, downside risks open toward 147.00 and potentially the full supply at 145.00.
📌 Trade Smart: Wait for price confirmation, manage risk with stop placement below the demand zone or structure lows, and avoid chasing the move.
📊 Market Structure Overview:
USDJPY has shown a clean bullish structure in recent sessions, supported by a strong demand retest and a steady parabolic curve formation (Black Mind Curve Line). The pair has successfully broken above a major resistance, retested it, and is now holding higher ground—suggesting potential for continued upside if current structure holds.
🧱 Detailed Technical Breakdown:
🔹 1. Demand & Retesting Behavior
The chart highlights a key demand zone (green box) that was previously used after a bullish move.
Price recently returned to this zone for a clean retest, validating its role as a strong support.
This type of retesting behavior is critical in smart money analysis, confirming that accumulation has occurred and sellers have been absorbed.
🔹 2. Major Breakout Confirmation
The previous major structure level has been decisively broken to the upside.
This level now acts as support, increasing the probability that the bullish move will sustain.
🔹 3. Black Mind Curve Line (Parabolic Structure)
A parabolic curved trendline supports the current price action, showing how bulls are gradually gaining momentum.
This curve represents buyer interest increasing over time, which often leads to an aggressive breakout when paired with retest confirmation.
📍 Key Price Zones:
Type Price Level (Approx.) Description
🔹 Retesting Zone ~148.800 – 149.100 Support zone after major breakout
🔺 Resistance Target (1) ~150.500 Bullish breakout target (short-term)
🔻 Downside Risk (2) ~147.000 – 146.500 Bearish invalidation zone if demand fails
🔹 Full Supply Area ~145.000 – 145.500 Historical supply zone if price fails completely
🔮 Trade Scenarios:
✅ Scenario 1 – Bullish Continuation (Primary Bias)
Retest is complete, and price is holding above the curve and demand zone.
If bullish momentum continues:
📈 Target 1: 150.50 – Near-term resistance and liquidity area
📈 Target 2: 151.20+ – Extension target if buyers dominate
Bullish Confirmation:
Price must stay above ~149.00 and continue forming higher highs.
Entry ideas: Wait for minor consolidation above current price or bullish breakout from mini range.
⚠️ Scenario 2 – Bearish Rejection
If price rejects from current level and breaks below the curve and demand zone (~148.80):
📉 First downside target: 147.00 (minor support)
📉 Final bearish target: 145.50 (full supply zone)
Bearish Confirmation:
Breakdown of curve support and close below the retesting zone with momentum.
Such a move would suggest buyers failed, and market may rotate lower.
🧠 Market Sentiment & Psychology:
Smart Money Behavior: Demand was filled cleanly and retested, indicating possible institutional interest at that level.
Momentum Curve: As shown by the black curve, momentum is rising gradually—this reflects confidence building among buyers.
However, price is near psychological resistance (150.00–150.50 zone), where heavy sell orders might be placed.
The market is in a decision zone, where confirmation of strength or failure will dictate the next 200–300 pip move.
🎯 Summary:
USDJPY is showing a bullish structure supported by:
A valid retest of demand
A clean breakout of major resistance
An ascending parabolic curve
If bulls defend the current zone, we may see a powerful continuation toward 150.50+. If price fails to hold above the retest zone, downside risks open toward 147.00 and potentially the full supply at 145.00.
📌 Trade Smart: Wait for price confirmation, manage risk with stop placement below the demand zone or structure lows, and avoid chasing the move.
For Daily Trade Setups and Forecast: 📈 t.me/xauusdoptimizer
Premium Signals Fr33: 💯 t.me/xauusdoptimizer
🥰🥳🤩
Premium Signals Fr33: 💯 t.me/xauusdoptimizer
🥰🥳🤩
Related publications
Disclaimer
The information and publications are not meant to be, and do not constitute, financial, investment, trading, or other types of advice or recommendations supplied or endorsed by TradingView. Read more in the Terms of Use.