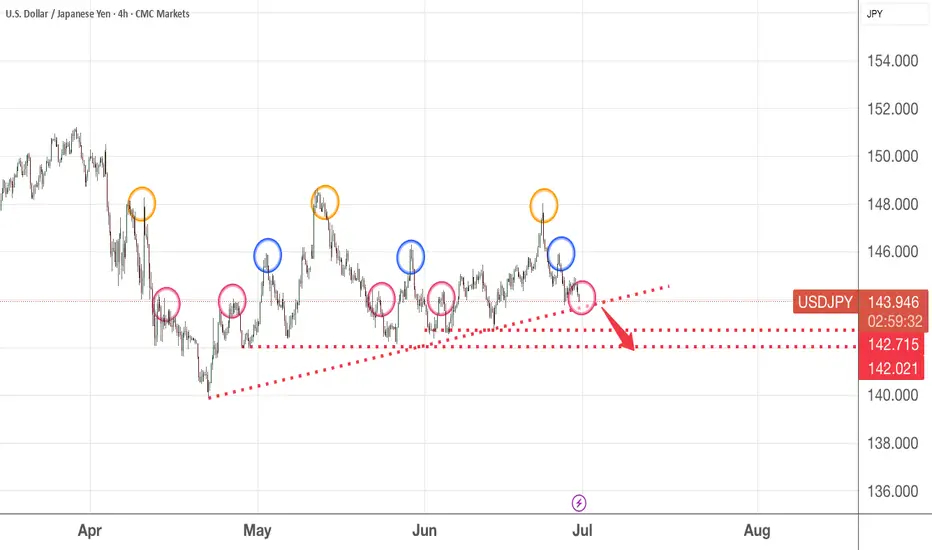
In this 4H chart, if you observe closely - the orange circle shows the peak at 148 price level
then, it falls to the blue circle at 146 price level before settling lower at the 143 price level. This is also where we are now.
I believe it is likely to break down further for which I have indicated a potential profit target.
then, it falls to the blue circle at 146 price level before settling lower at the 143 price level. This is also where we are now.
I believe it is likely to break down further for which I have indicated a potential profit target.
Disclaimer
The information and publications are not meant to be, and do not constitute, financial, investment, trading, or other types of advice or recommendations supplied or endorsed by TradingView. Read more in the Terms of Use.
Disclaimer
The information and publications are not meant to be, and do not constitute, financial, investment, trading, or other types of advice or recommendations supplied or endorsed by TradingView. Read more in the Terms of Use.