🗺️ Market Structure & Key Technical Zones
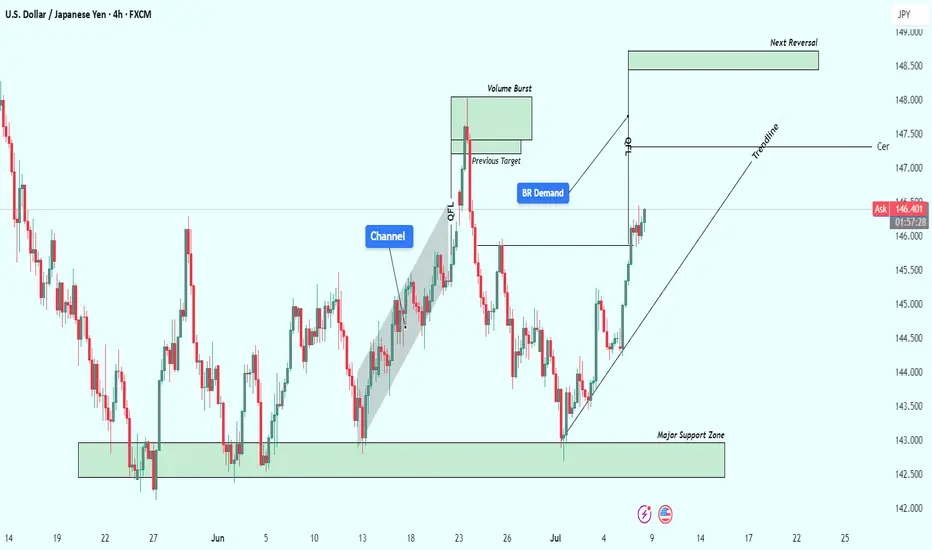
On the USDJPY 4-hour timeframe, the market is clearly respecting smart money levels and giving us an ideal case study of institutional demand, trend continuation, and liquidity engineering.
🔰 1. Major Support Zone (142.500 – 143.200):
This zone acted as a high-value area where price consolidated previously before rallying. It has been tested multiple times and each touch has led to a strong bullish reaction, indicating accumulation by large players.
Think of this zone as the market’s base camp — when price visits it, big money steps in to reload longs.
🔰 2. Channel Formation & Breakout:
A clean bullish channel formed mid-June, with price respecting both bounds while gradually climbing. Once the channel was broken with strong volume (noted by the breakout candle), it suggested a shift from controlled bullish flow to an impulsive move — a change in pace that often indicates smart money is active.
🧱 Institutional Concepts in Action
🔵 QFL (Quick Flip Level):
This area marks a prior consolidation or sideways action that gets aggressively broken. In this chart, price dipped to a QFL zone then sharply reversed — suggesting a trap for early shorts and a liquidity grab before moving up. A classic “manipulation → accumulation → expansion” sequence.
🟦 Breaker Demand (BR Demand):
This is where previous resistance has flipped into new support. Breaker blocks are extremely important in identifying where institutions may re-enter positions. Price respected this area before continuing higher — confirming bullish control.
Price tapped into this BR demand, showed low-wick rejections, and moved strongly, signaling confidence from large orders.
📊 Volume Burst Zone (~147.2–147.7):
This zone has historically seen high volume and sudden price acceleration. Price is re-approaching it now. This is where a lot of pending orders and take-profits are likely clustered — expect strong reactions here.
📈 Current Price Action
Price is climbing along a clean bullish trendline, reinforcing current momentum.
Price has broken previous structure highs and is now making higher highs and higher lows — a textbook bullish trend.
Buyers are in control as long as the price continues to respect:
The bullish trendline
The BR demand zone (~145.5)
🔮 Projection & Potential Scenarios
🟢 Bullish Continuation Case:
If current momentum holds, the price is likely to push toward the Next Reversal Zone (148.500–149.000).
This zone aligns with multiple confluences:
Fibonacci extension targets
Previous high liquidity trap zone
Potential institutional profit-taking level
Expect this zone to cause a reversal or deep pullback.
🔴 Bearish Breakdown Case:
If price breaks below the BR Demand Zone and closes under the trendline, expect a drop back toward the Central Zone (~144.8–145.0), or even deeper into the Major Support Zone.
This would shift market structure back to neutral or bearish depending on volume and rejection patterns.
📌 Summary:
✅ Bias: Bullish
🎯 Short-Term Target: 147.5 (volume burst area)
🧱 Key Support: 145.50 (breaker demand)
❗ Trendline Break = Red Flag
🏁 Final Reversal Zone: 148.500–149.000
💬 Final Thoughts
This chart is a brilliant example of smart money accumulation and market engineering. USDJPY continues to respect well-defined zones, presenting high-probability opportunities for traders who understand structure and patience.
This setup is NOT about chasing price — it's about following the footprints of volume, breakout structure, and institutional intent. Stick to the plan and manage risk around key invalidation zones.
For Daily Trade Setups and Forecast: 📈 t.me/xauusdoptimizer
Premium Signals Fr33: 💯 t.me/xauusdoptimizer
🥰🥳🤩
Premium Signals Fr33: 💯 t.me/xauusdoptimizer
🥰🥳🤩
Related publications
Disclaimer
The information and publications are not meant to be, and do not constitute, financial, investment, trading, or other types of advice or recommendations supplied or endorsed by TradingView. Read more in the Terms of Use.