SMC Trading point update
Technical analysis of USD/JPY on the 4-hour timeframe suggests a bullish setup with the following key insights:
Analysis Overview:
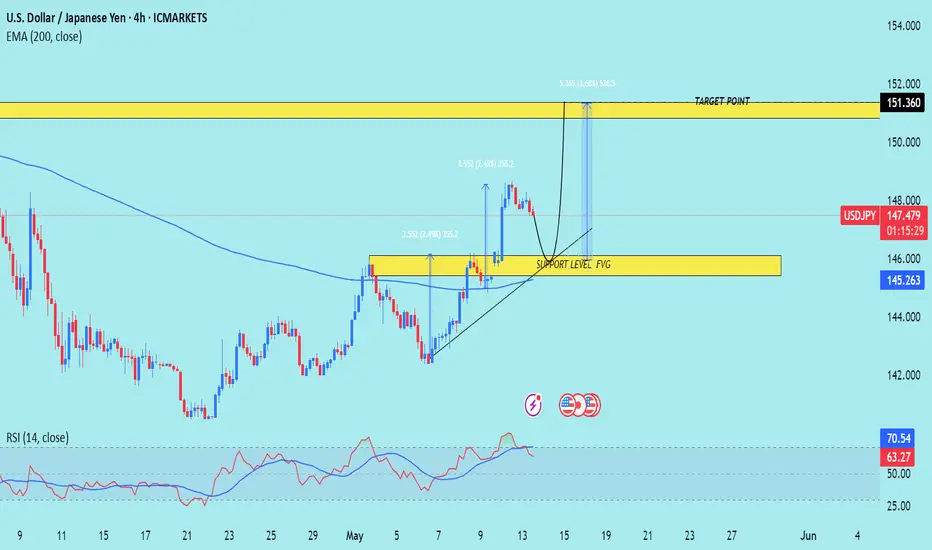
1. Current Price: 147.492
2. Support Zone: Around 145.263 to 146.000
Marked as "Support Level / FVG" (Fair Value Gap), this is the potential demand zone where the price may retrace before bouncing.
3. Trendline: An ascending trendline is supporting the bullish structure.
4. EMA 200: Price is trading above the 200 EMA (145.263), which is generally a bullish signal.
5. RSI Indicator:
RSI is near overbought levels (currently at 63.46 and 70.56), suggesting strong bullish momentum but a potential pullback.
6. Target Zone: 151.360
Highlighted as the "Target Point" – this is the resistance area where price might face selling pressure.
Mr SMC Trading point
Trade Idea:
Entry: Buy on retracement into the support zone (around 145.5–146.0).
Stop Loss: Below the support zone or EMA (around 144.800 or as per risk tolerance).
Take Profit: Near the target zone around 151.360.
Risk-to-Reward: Favorable, approximately 1:2.5 to 1:3 depending on the entry.
Conclusion:
The idea is based on price respecting support, fair value gap (FVG), bullish structure, and a target based on recent price projections. If the price respects the support and bullish trendline, the bullish continuation towards 151.360 is a valid expectation.
Pales support boost 🚀 analysis follow)
Technical analysis of USD/JPY on the 4-hour timeframe suggests a bullish setup with the following key insights:
Analysis Overview:
1. Current Price: 147.492
2. Support Zone: Around 145.263 to 146.000
Marked as "Support Level / FVG" (Fair Value Gap), this is the potential demand zone where the price may retrace before bouncing.
3. Trendline: An ascending trendline is supporting the bullish structure.
4. EMA 200: Price is trading above the 200 EMA (145.263), which is generally a bullish signal.
5. RSI Indicator:
RSI is near overbought levels (currently at 63.46 and 70.56), suggesting strong bullish momentum but a potential pullback.
6. Target Zone: 151.360
Highlighted as the "Target Point" – this is the resistance area where price might face selling pressure.
Mr SMC Trading point
Trade Idea:
Entry: Buy on retracement into the support zone (around 145.5–146.0).
Stop Loss: Below the support zone or EMA (around 144.800 or as per risk tolerance).
Take Profit: Near the target zone around 151.360.
Risk-to-Reward: Favorable, approximately 1:2.5 to 1:3 depending on the entry.
Conclusion:
The idea is based on price respecting support, fair value gap (FVG), bullish structure, and a target based on recent price projections. If the price respects the support and bullish trendline, the bullish continuation towards 151.360 is a valid expectation.
Pales support boost 🚀 analysis follow)
Trade active
(Services:✔️ JOIN Telegram channel
#Gold trading ★Analysis★ 📊
Gold trading signals 🚀 99%
t.me/SmcTradingPoin
Join my recommended broker , link 👇
World best broker exness ✅D
one.exnesstrack.org/a/l1t1rf3p6v
#Gold trading ★Analysis★ 📊
Gold trading signals 🚀 99%
t.me/SmcTradingPoin
Join my recommended broker , link 👇
World best broker exness ✅D
one.exnesstrack.org/a/l1t1rf3p6v
Related publications
Disclaimer
The information and publications are not meant to be, and do not constitute, financial, investment, trading, or other types of advice or recommendations supplied or endorsed by TradingView. Read more in the Terms of Use.