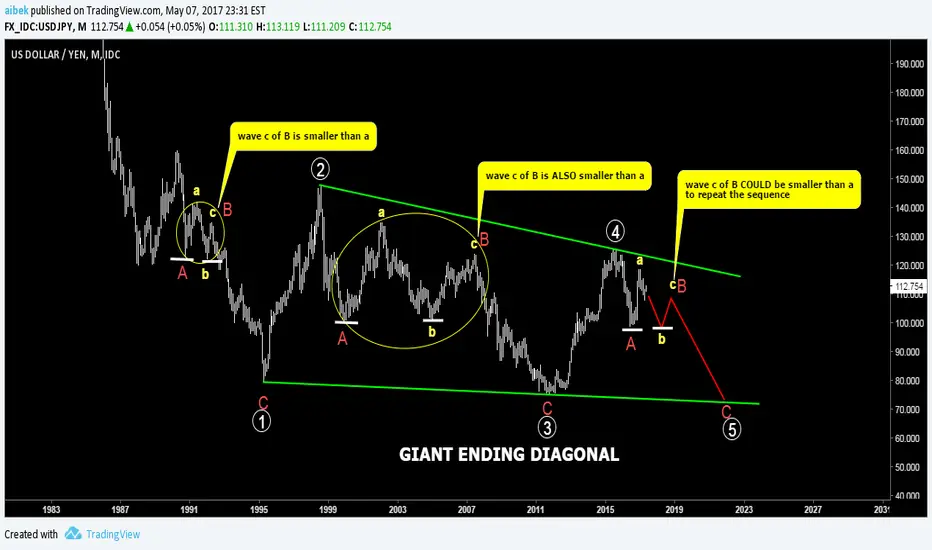
This is the long term chart depicting the possible Ending Diagonal Pattern (green).
What is interesting that small waves c (yellow) of the countertrend waves B (red) already two times are smaller that waves a (yellow).
If this sequence would persist then it's quite possible to have it in the last wave down as projected with the red polyline.
The pair could hit the downside of the pattern at 70 level in wave (5).
Note
amazingly follows the pattern set 30 (!) years ago...I hated geometry at school but this is just a miracle )))Disclaimer
The information and publications are not meant to be, and do not constitute, financial, investment, trading, or other types of advice or recommendations supplied or endorsed by TradingView. Read more in the Terms of Use.
Disclaimer
The information and publications are not meant to be, and do not constitute, financial, investment, trading, or other types of advice or recommendations supplied or endorsed by TradingView. Read more in the Terms of Use.