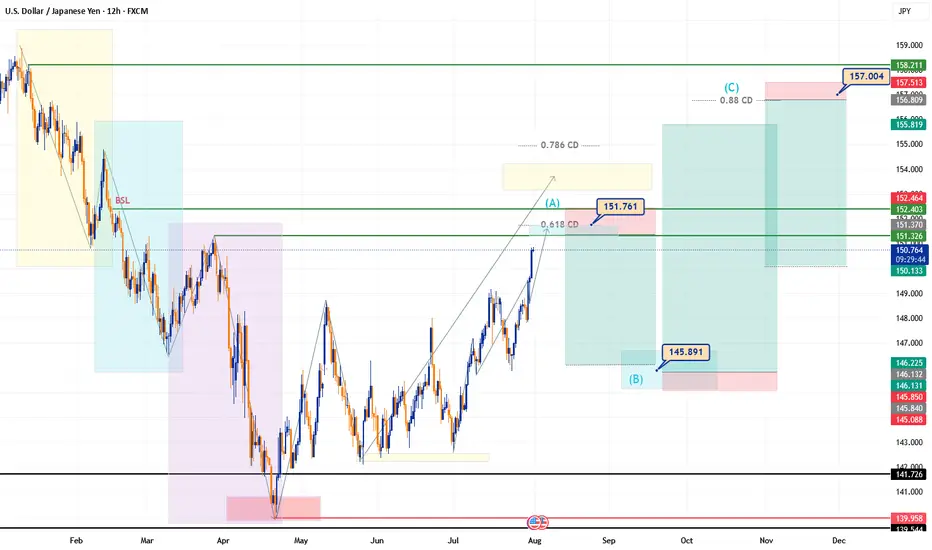
The USDJPY pair ends the month of July with a strong bullish impulse reaching 150.6, a price area that may signal the exhaustion of the uptrend that has dominated throughout the month.
An ongoing ABC harmonic structure is taking shape, with wave A likely completing between 151.36 and 152.00, which aligns with the 0.618 CD retracement — a confluence that reinforces the zone as a key resistance area.
From there, a potential bearish correction (wave B) may develop, targeting the 145.89 region. If this structure plays out correctly, a final bullish expansion (wave C) could aim for the 157.05 area.
Key Zones for the Week:
⚠️ Disclaimer
The correction of July’s bullish trend may begin before reaching the expected zone (151.36–152.00) due to liquidity buildup beneath current levels. A premature reversal is possible if institutional players decide to hunt that liquidity before continuing the larger move.
💬 “Sometimes it’s not about if it will get there, but when they let you in. If the party’s heating up above, check if they’re locking the door from below.”
Order Setup (Speculative Idea)
Sell Limit Order
Use this as a reference setup. Always manage your risk and adapt based on evolving price action
An ongoing ABC harmonic structure is taking shape, with wave A likely completing between 151.36 and 152.00, which aligns with the 0.618 CD retracement — a confluence that reinforces the zone as a key resistance area.
From there, a potential bearish correction (wave B) may develop, targeting the 145.89 region. If this structure plays out correctly, a final bullish expansion (wave C) could aim for the 157.05 area.
Key Zones for the Week:
- Projected exhaustion zone (wave A): 151.36 – 152.00
- Expected pullback (wave B): 145.89
- Final bullish target (wave C): 157.05
⚠️ Disclaimer
The correction of July’s bullish trend may begin before reaching the expected zone (151.36–152.00) due to liquidity buildup beneath current levels. A premature reversal is possible if institutional players decide to hunt that liquidity before continuing the larger move.
💬 “Sometimes it’s not about if it will get there, but when they let you in. If the party’s heating up above, check if they’re locking the door from below.”
Order Setup (Speculative Idea)
Sell Limit Order
- Entry (Open): 151.362
- Stop Loss (SL): 152.403
- Take Profit (TP): 146.210
- Risk–Reward Ratio: 4.79
Use this as a reference setup. Always manage your risk and adapt based on evolving price action
Disclaimer
The information and publications are not meant to be, and do not constitute, financial, investment, trading, or other types of advice or recommendations supplied or endorsed by TradingView. Read more in the Terms of Use.
Disclaimer
The information and publications are not meant to be, and do not constitute, financial, investment, trading, or other types of advice or recommendations supplied or endorsed by TradingView. Read more in the Terms of Use.