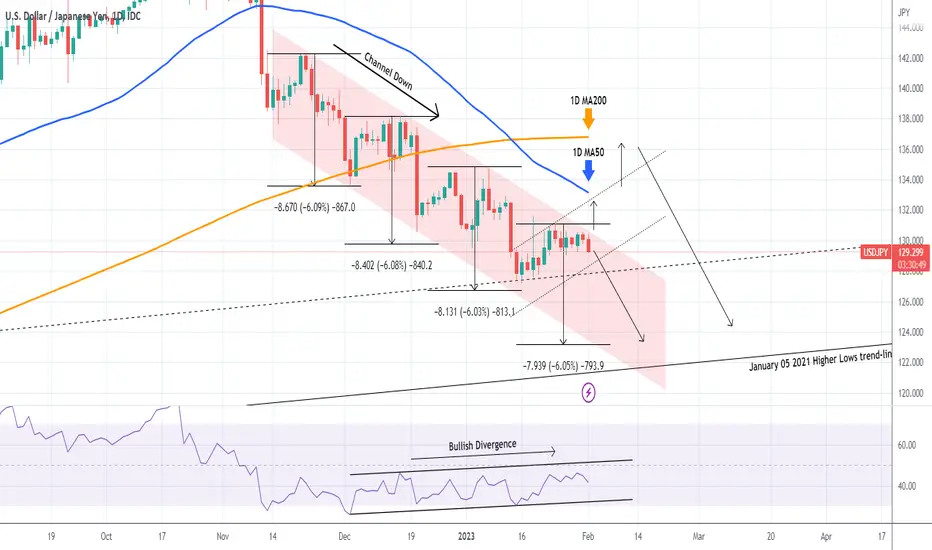
The USDJPY pair has been trading within an extremely well structured Channel Down since the November 21 2022 High. Every Lower Lows since then has been very symmetrical on approximately a -6.05% drop from the Lower High. With the price currently on the top (Lower Highs trend-line) of the Channel Down, this is technically the most optimal level to sell. A -6.05% drop from the Lower High, gives us a 123.315 price target.
We must be careful however, especially ahead of the Fed Rate Decision, as the 1D RIS hasn been trading within a Channel Up, while the price is on a Channel Down, signalling a Bearish Divergence. A break above the Channel Up, and more importantly the last Lower High can push the price to the 1D MA50 (blue trend-line) on the short-term and if broken, then the 1D MA200 (orange trend-line) on the medium-term.
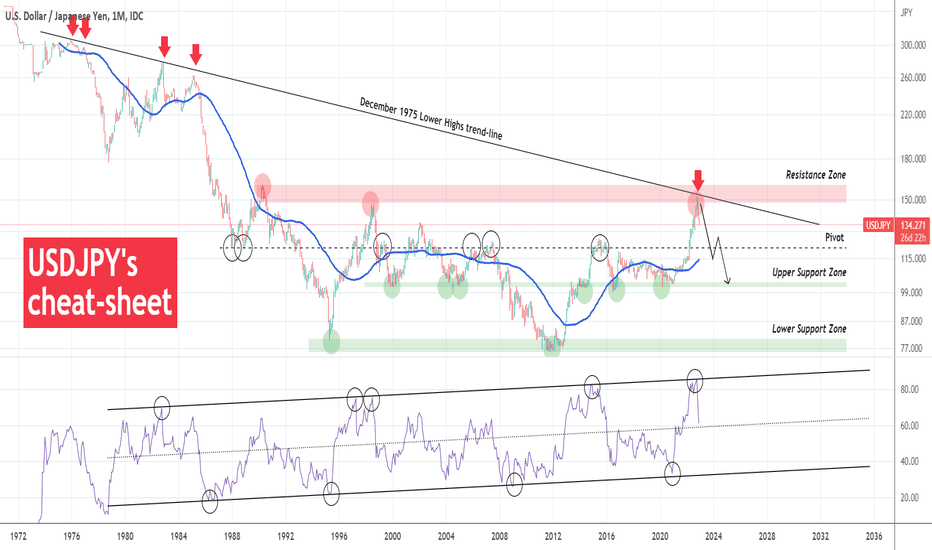
The long-term bearish trend shouldn't be affected by this so in that case we will be looking for the safest short entry on the top. Below you can see our long-term cheat-sheet on USDJPY:
-------------------------------------------------------------------------------
** Please LIKE 👍, FOLLOW ✅, SHARE 🙌 and COMMENT ✍ if you enjoy this idea! Also share your ideas and charts in the comments section below! **
-------------------------------------------------------------------------------
💸💸💸💸💸💸
👇 👇 👇 👇 👇 👇
We must be careful however, especially ahead of the Fed Rate Decision, as the 1D RIS hasn been trading within a Channel Up, while the price is on a Channel Down, signalling a Bearish Divergence. A break above the Channel Up, and more importantly the last Lower High can push the price to the 1D MA50 (blue trend-line) on the short-term and if broken, then the 1D MA200 (orange trend-line) on the medium-term.
The long-term bearish trend shouldn't be affected by this so in that case we will be looking for the safest short entry on the top. Below you can see our long-term cheat-sheet on USDJPY:
-------------------------------------------------------------------------------
** Please LIKE 👍, FOLLOW ✅, SHARE 🙌 and COMMENT ✍ if you enjoy this idea! Also share your ideas and charts in the comments section below! **
-------------------------------------------------------------------------------
💸💸💸💸💸💸
👇 👇 👇 👇 👇 👇
👑Best Signals (Forex/Crypto+70% accuracy) & Account Management (+20% profit/month on 10k accounts)
💰Free Channel t.me/tradingshotglobal
🤵Contact info@tradingshot.com t.me/tradingshot
🔥New service: next X100 crypto GEMS!
💰Free Channel t.me/tradingshotglobal
🤵Contact info@tradingshot.com t.me/tradingshot
🔥New service: next X100 crypto GEMS!
Disclaimer
The information and publications are not meant to be, and do not constitute, financial, investment, trading, or other types of advice or recommendations supplied or endorsed by TradingView. Read more in the Terms of Use.