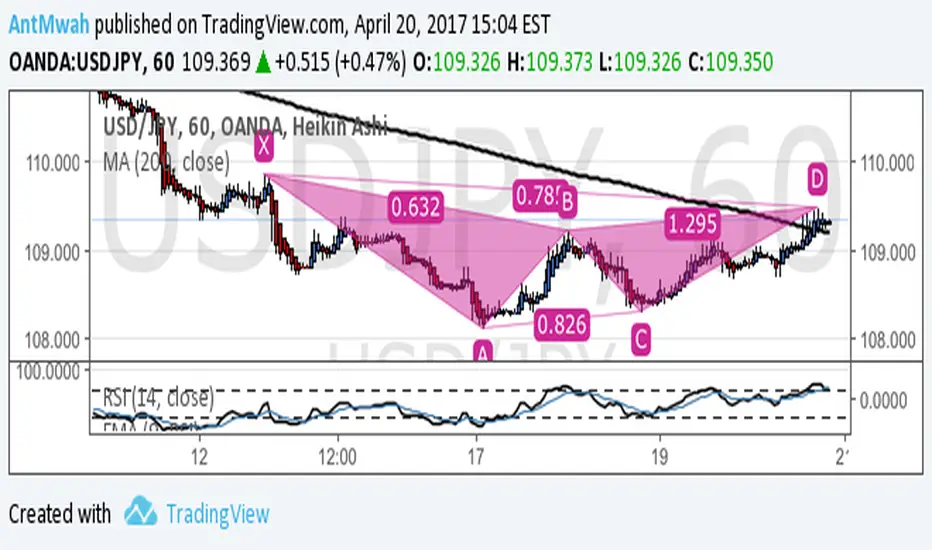
1hr chart. Gartley formation.
Struggled again at 109.350 / 109.4 which is 50% Fib line on my daily charts.
Struggled again at 109.350 / 109.4 which is 50% Fib line on my daily charts.
Related publications
Disclaimer
The information and publications are not meant to be, and do not constitute, financial, investment, trading, or other types of advice or recommendations supplied or endorsed by TradingView. Read more in the Terms of Use.
Related publications
Disclaimer
The information and publications are not meant to be, and do not constitute, financial, investment, trading, or other types of advice or recommendations supplied or endorsed by TradingView. Read more in the Terms of Use.