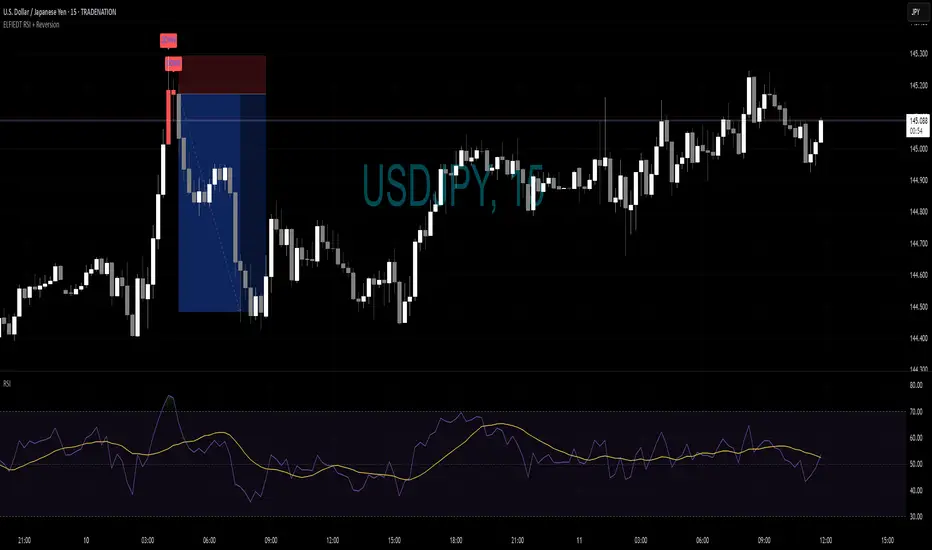
📉 How This Sell Setup Could Have Been Traded – USDJPY, 15min
This is a great example of how the ELFIEDT RSI + 3SD Reversion Strategy can help identify short-term exhaustion and provide a clean sell opportunity.
🔻 What Happened in This Example:
Double Sell Signal Fired
Two "DOWN" signals printed at the top of the move, indicating that price had pushed significantly beyond its upper volatility band, with RSI showing an overbought condition and volume confirming the move.
Price Exhaustion Candle
The second signal came after a strong wick rejection (long upper wick), suggesting buyers were losing control. This type of candle acts as a reversal clue — especially powerful when backed by the indicator.
Momentum Shift in RSI
Shortly after the signal, RSI began rolling over and crossed below its smoothing average, confirming that the upward momentum was fading.
Sharp Reversal
Price quickly sold off after the signal cluster, offering a clean short with minimal drawdown and solid follow-through.
✅ How You Could Have Traded It:
📌 Wait for the “DOWN” signal(s) to print, signaling a statistically overbought zone.
📉 Look for a reversal-style candle near the signal — like a bearish engulfing or long upper wick (as seen here).
🔎 Confirm that RSI is starting to turn down from an extended zone.
🛑 Place a stop just above the signal wick and aim for a reward that aligns with the next support or a 1:2+ target.
🔁 Bonus Tip – Multi-Timeframe Filter:
If the same signal zone shows up on a higher timeframe (like the 1H), this becomes a high-conviction sell setup. Look for alignment across 15min and 1H for best results.
This setup shows how the ELFIEDT strategy blends data-driven exhaustion signals with visual price action for clean intraday reversals.
Note
📌 Pinned Comment — Please Read FirstHi everyone 👋
Thanks for checking out the ELFIEDT RSI + Reversion Strategy!
This script is designed to help traders identify potential price exhaustion zones using a blend of statistical volatility, RSI momentum, and volume spikes. Everything shared here — including the trade examples, signal breakdowns, and chart commentary — is intended purely for educational and informational purposes.
🧠 What You Can Expect Here:
Clear examples showing how the script has worked on past price action
Tips on combining signals with candlestick patterns, RSI divergence, or multi-timeframe confluence
Ideas to help you understand how price behaves at extremes — not financial advice or guaranteed trade signals
⚠️ Please remember: This is not financial advice. Always do your own research, manage your risk, and test everything in a way that fits your trading style and experience.
Let me know how you’re using the script or if you'd like to see new features added!
Happy trading!
– ELFIEDT 💚
Join us to get free access to all indicators we created!
Disclaimer
The information and publications are not meant to be, and do not constitute, financial, investment, trading, or other types of advice or recommendations supplied or endorsed by TradingView. Read more in the Terms of Use.
Join us to get free access to all indicators we created!
Disclaimer
The information and publications are not meant to be, and do not constitute, financial, investment, trading, or other types of advice or recommendations supplied or endorsed by TradingView. Read more in the Terms of Use.