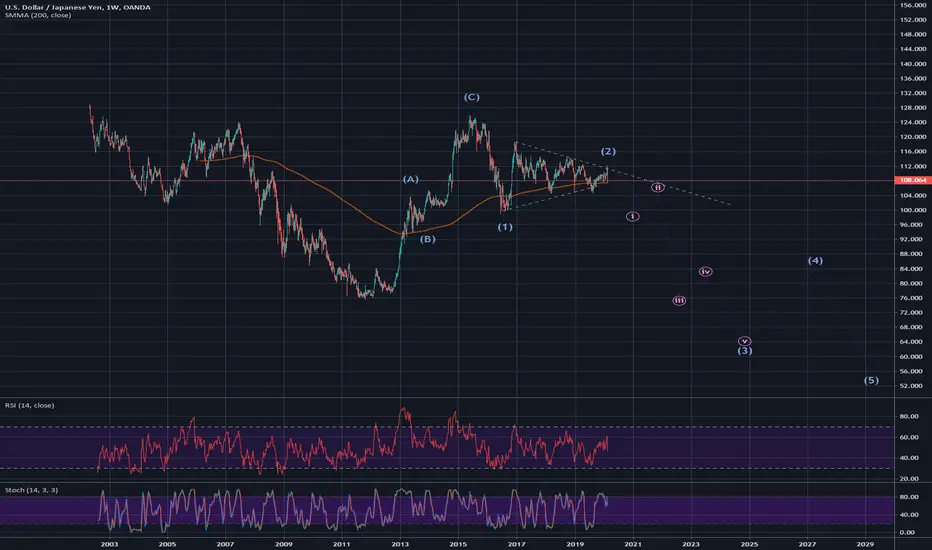
Stock market is melting (Nikkei long-term forecast is here) what always leads to USD/JPY fall. On weekly we can see 3 waves up between Oct’12 and May’15, then 1 motive wave down and triangle with failed break-out of the top. All this looks like USD/JPY has completed wave 2 and started its long march :-) down.
Related publications
Disclaimer
The information and publications are not meant to be, and do not constitute, financial, investment, trading, or other types of advice or recommendations supplied or endorsed by TradingView. Read more in the Terms of Use.
Related publications
Disclaimer
The information and publications are not meant to be, and do not constitute, financial, investment, trading, or other types of advice or recommendations supplied or endorsed by TradingView. Read more in the Terms of Use.