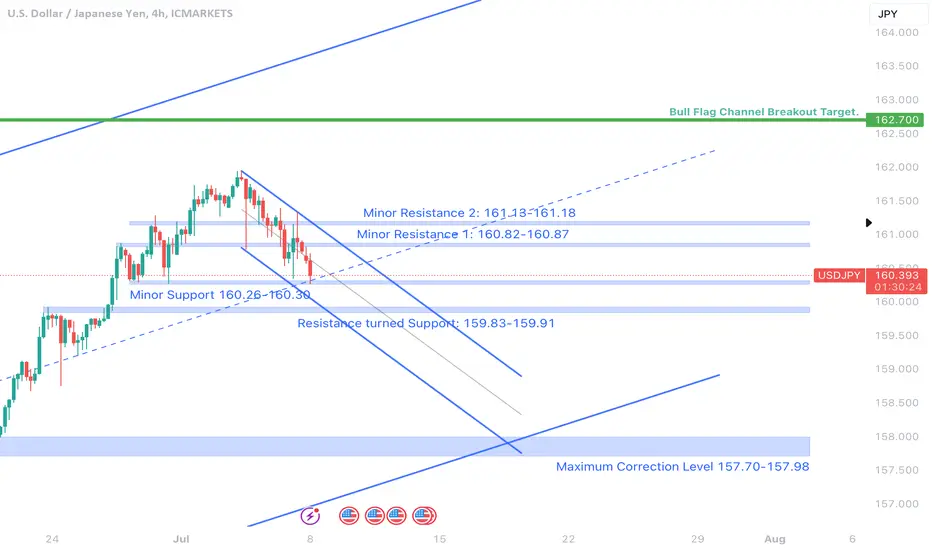
I have plotted out the key levels for resistance and support.
Nearest Resistance: 160.82-160.87
Nearest Support: 160.26-160.30
Resistance Turned Support: 159.83-159.91
Major Support: 157.70-157.98
Scenario 1
========
If Bullish Candlestick formed above 161.20 (Bull Flag Breakout), a continuation of Higher High will be around 162.70.
Scenario 2
========
If Bearish Candlestick Formed below 160.26, price will continue to correct to 159.83-159.91.
Scenario 3
========
Major Correction towards to 157.70-157.98 (probably takes 2-3 weeks to reach there).
Disclaimer
The information and publications are not meant to be, and do not constitute, financial, investment, trading, or other types of advice or recommendations supplied or endorsed by TradingView. Read more in the Terms of Use.
Disclaimer
The information and publications are not meant to be, and do not constitute, financial, investment, trading, or other types of advice or recommendations supplied or endorsed by TradingView. Read more in the Terms of Use.